
The Problem
Con Edison’s hazard reporting was slow, fragmented, and high risk. Field employees often waited 30–90+ minutes on a hotline, delaying incident response.
Reporting processes varied across six operational divisions—Gas, Electric, Steam, Construction, and others—resulting in inconsistent practices and no unified visibility. These gaps carried significant financial risk, with individual incidents exposing the company to $250K+ in potential litigation, while previous digital tools had failed to achieve adoption due to cultural resistance.
Any solution needed to meet strict safety compliance, including 911 protocols for gas hazards, while enabling a scalable, mobile-first platform that reduced friction and improved adoption.
Impact
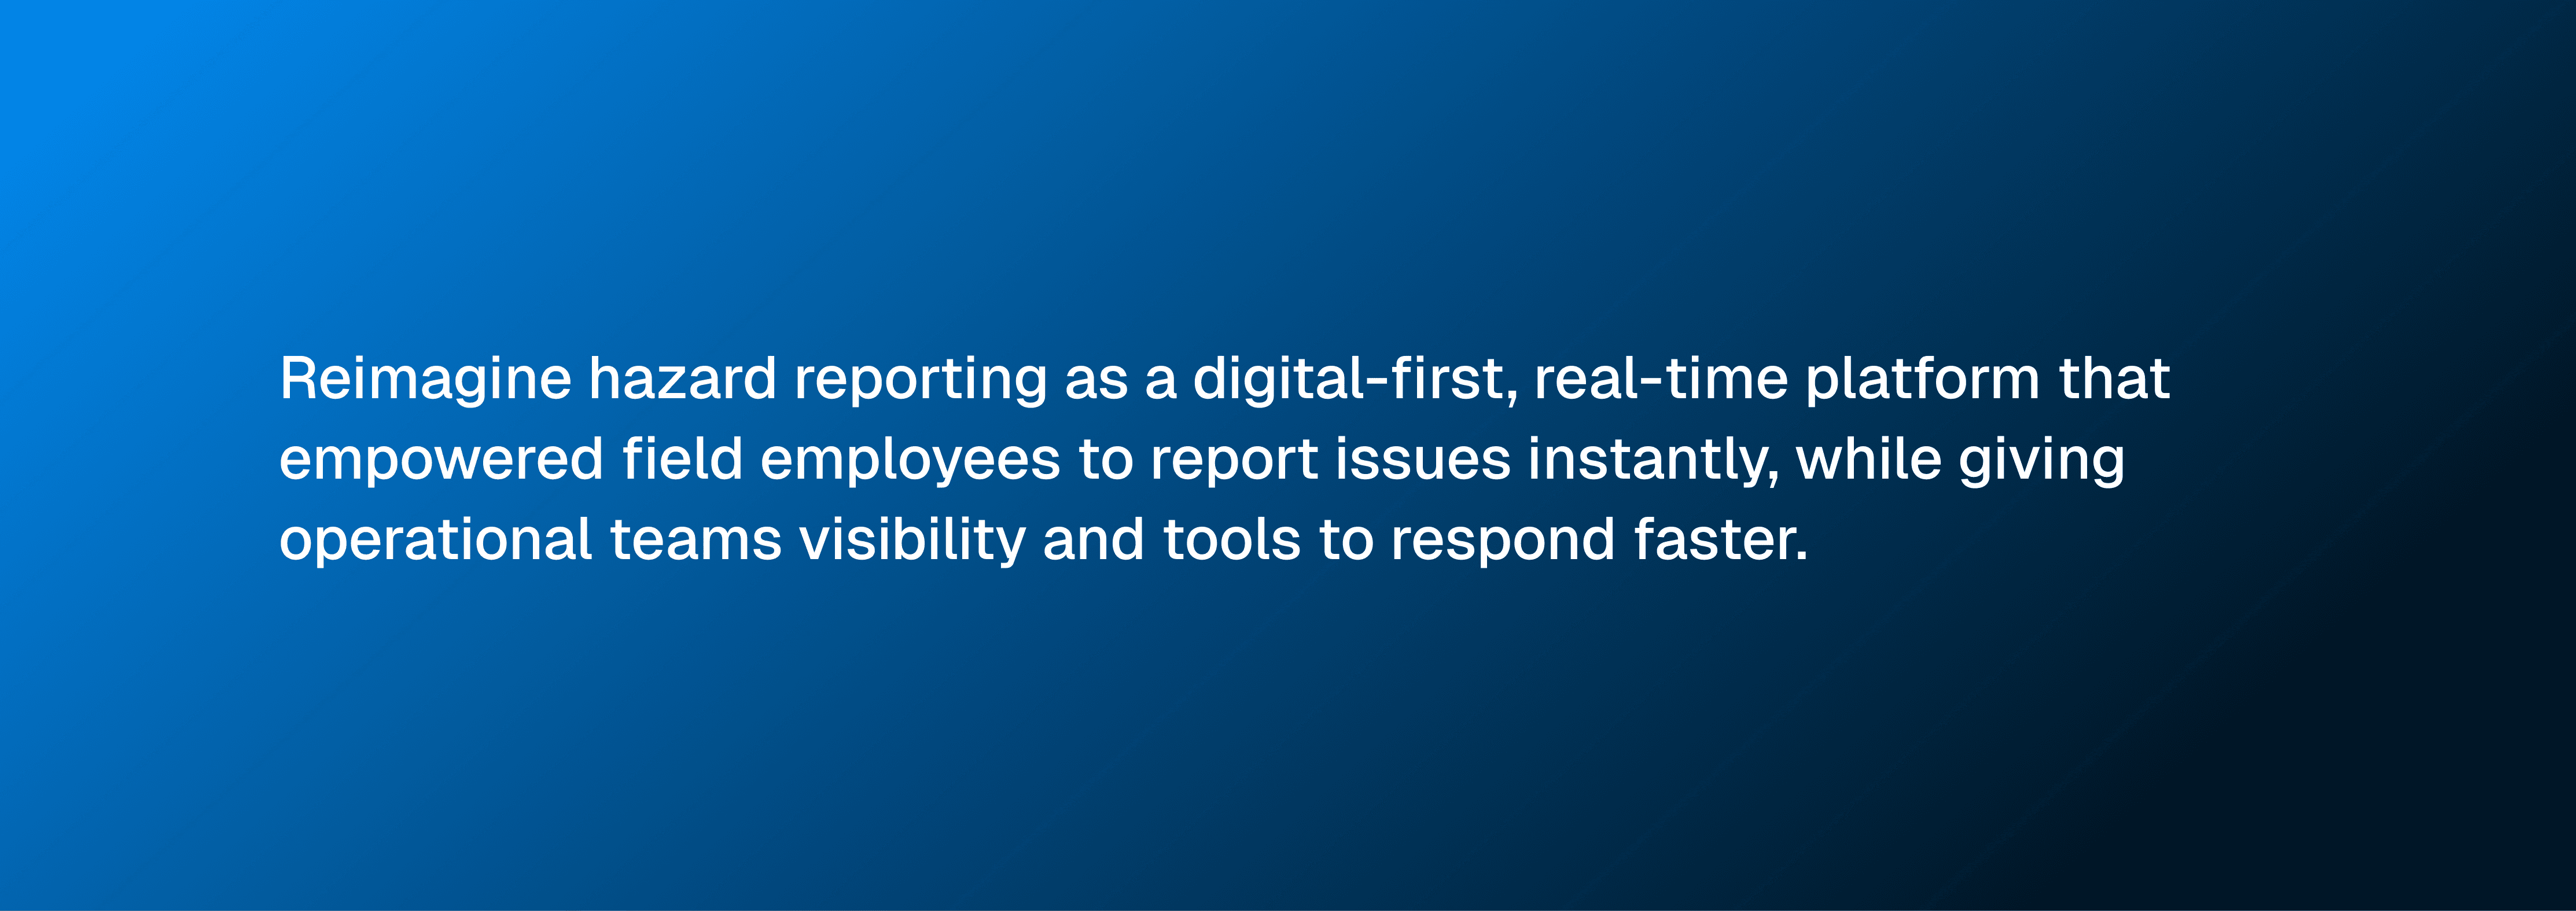
Beyond metrics, this project transformed hazard reporting from a slow, fragmented hotline into a unified, digital-first platform—shifting both workflow and culture.
~$250K+Potential cost avoided per incident through faster hazard reporting | ||
45 secondsAverage reporting time (down from 30–90+ minutes) | ||
85–90%Adoption across six operational divisions within the first two weeks |
Additional key outcomes: | ||
Unified six divisions under one mobile-first platform | ||
Contributed mobile-first data table and compliance patterns back to Enterprise Design System | ||
Enabled cross-division operational visibility, risk management, and proactive incident prevention |
The Mission
Research Insights
Early interviews with field employees, control center admins, and key stakeholders surfaced a consistent set of challenges: reporting via hotline introduced significant friction and delays, critical details were often lost or inconsistently captured, workflows varied by division, and supervisors lacked real-time visibility into active hazards. Compounding these issues, prior digital tools had failed due to unclear value and weak rollout, creating real adoption risk.
These insights shaped the core design strategy: make hazard reporting effortless for employees in the field while giving admin teams transparency, control, and confidence at enterprise scale.
My Role
As Design Lead, I owned product strategy, UX, and adoption from discovery through enterprise rollout.
Partnered with the VP of Operations to define success metrics and roadmap
Led cross-functional alignment workshops across six business units
Executed mobile-first design for field employees and admin dashboards for operational teams
Contributed scalable patterns back to the Enterprise Design System
Conceived Phase 2 AI strategy for automated hazard detection
Solutions & Strategic Decisions
Mobile-First Reporting
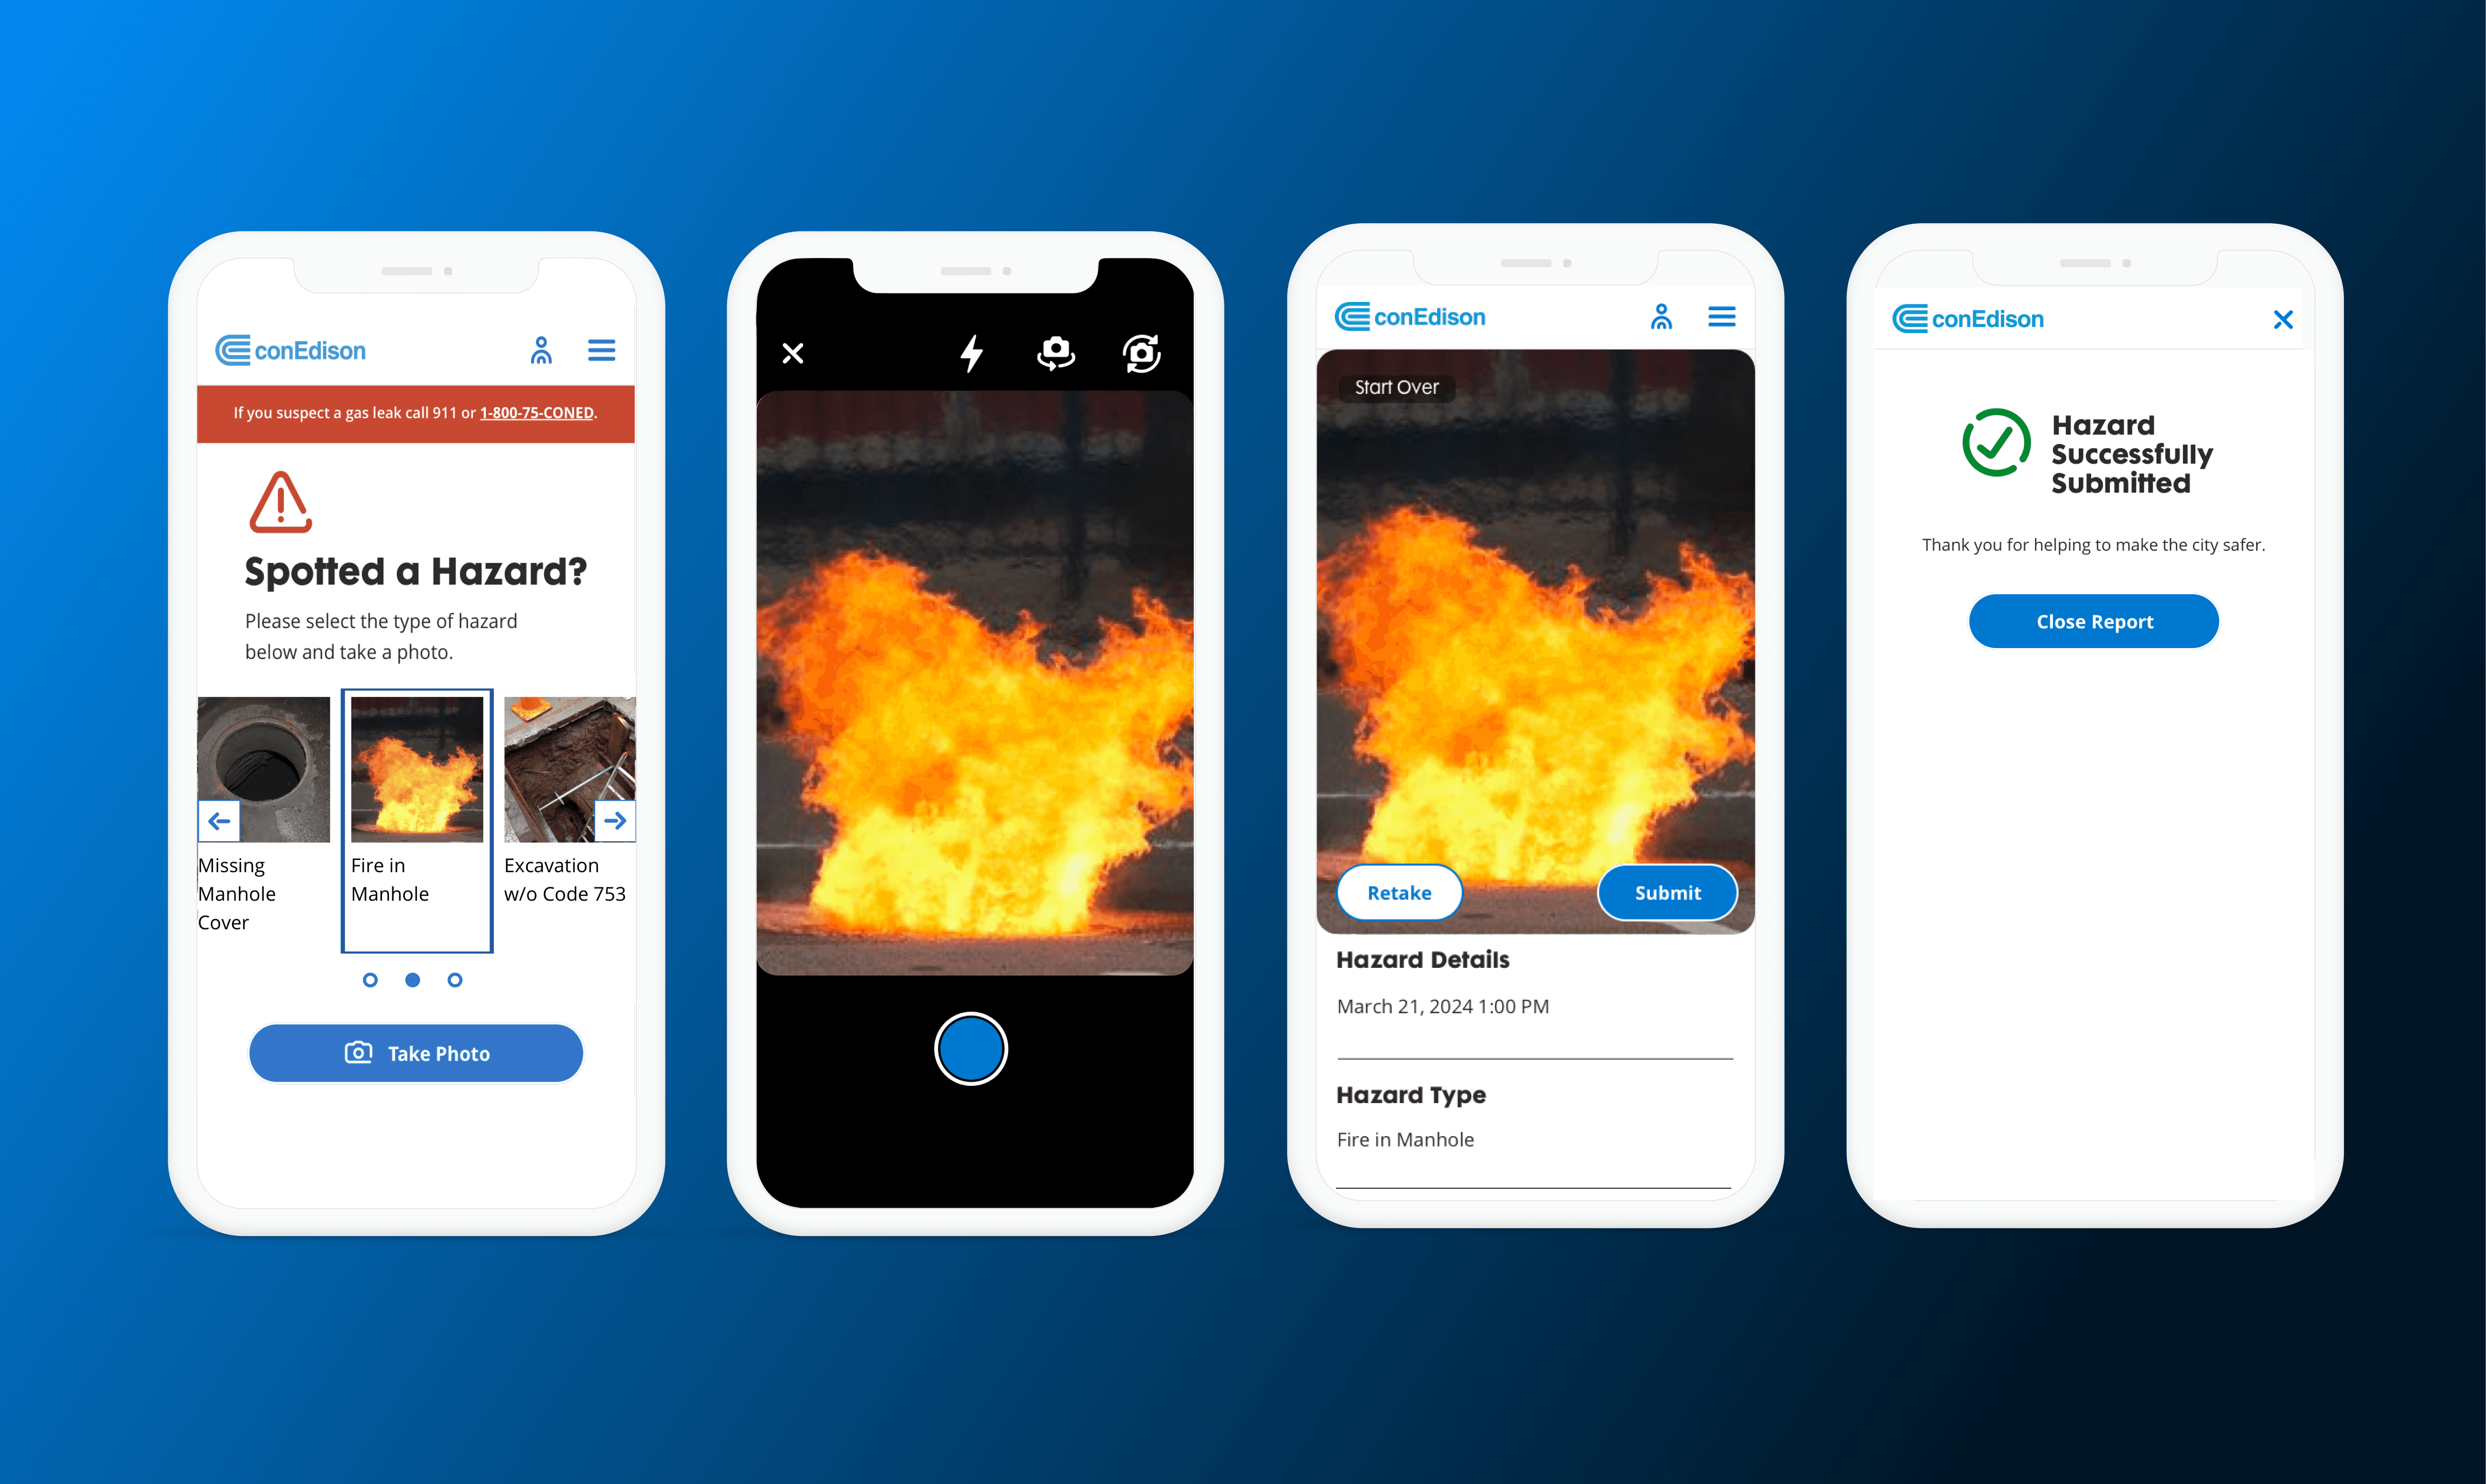
I designed a mobile-first reporting workflow—enable GPS → select hazard type → snap a photo → submit—so that hazard reports automatically routed to the correct team, eliminating manual entry and cutting reporting time from 30–90+ minutes to under a minute.
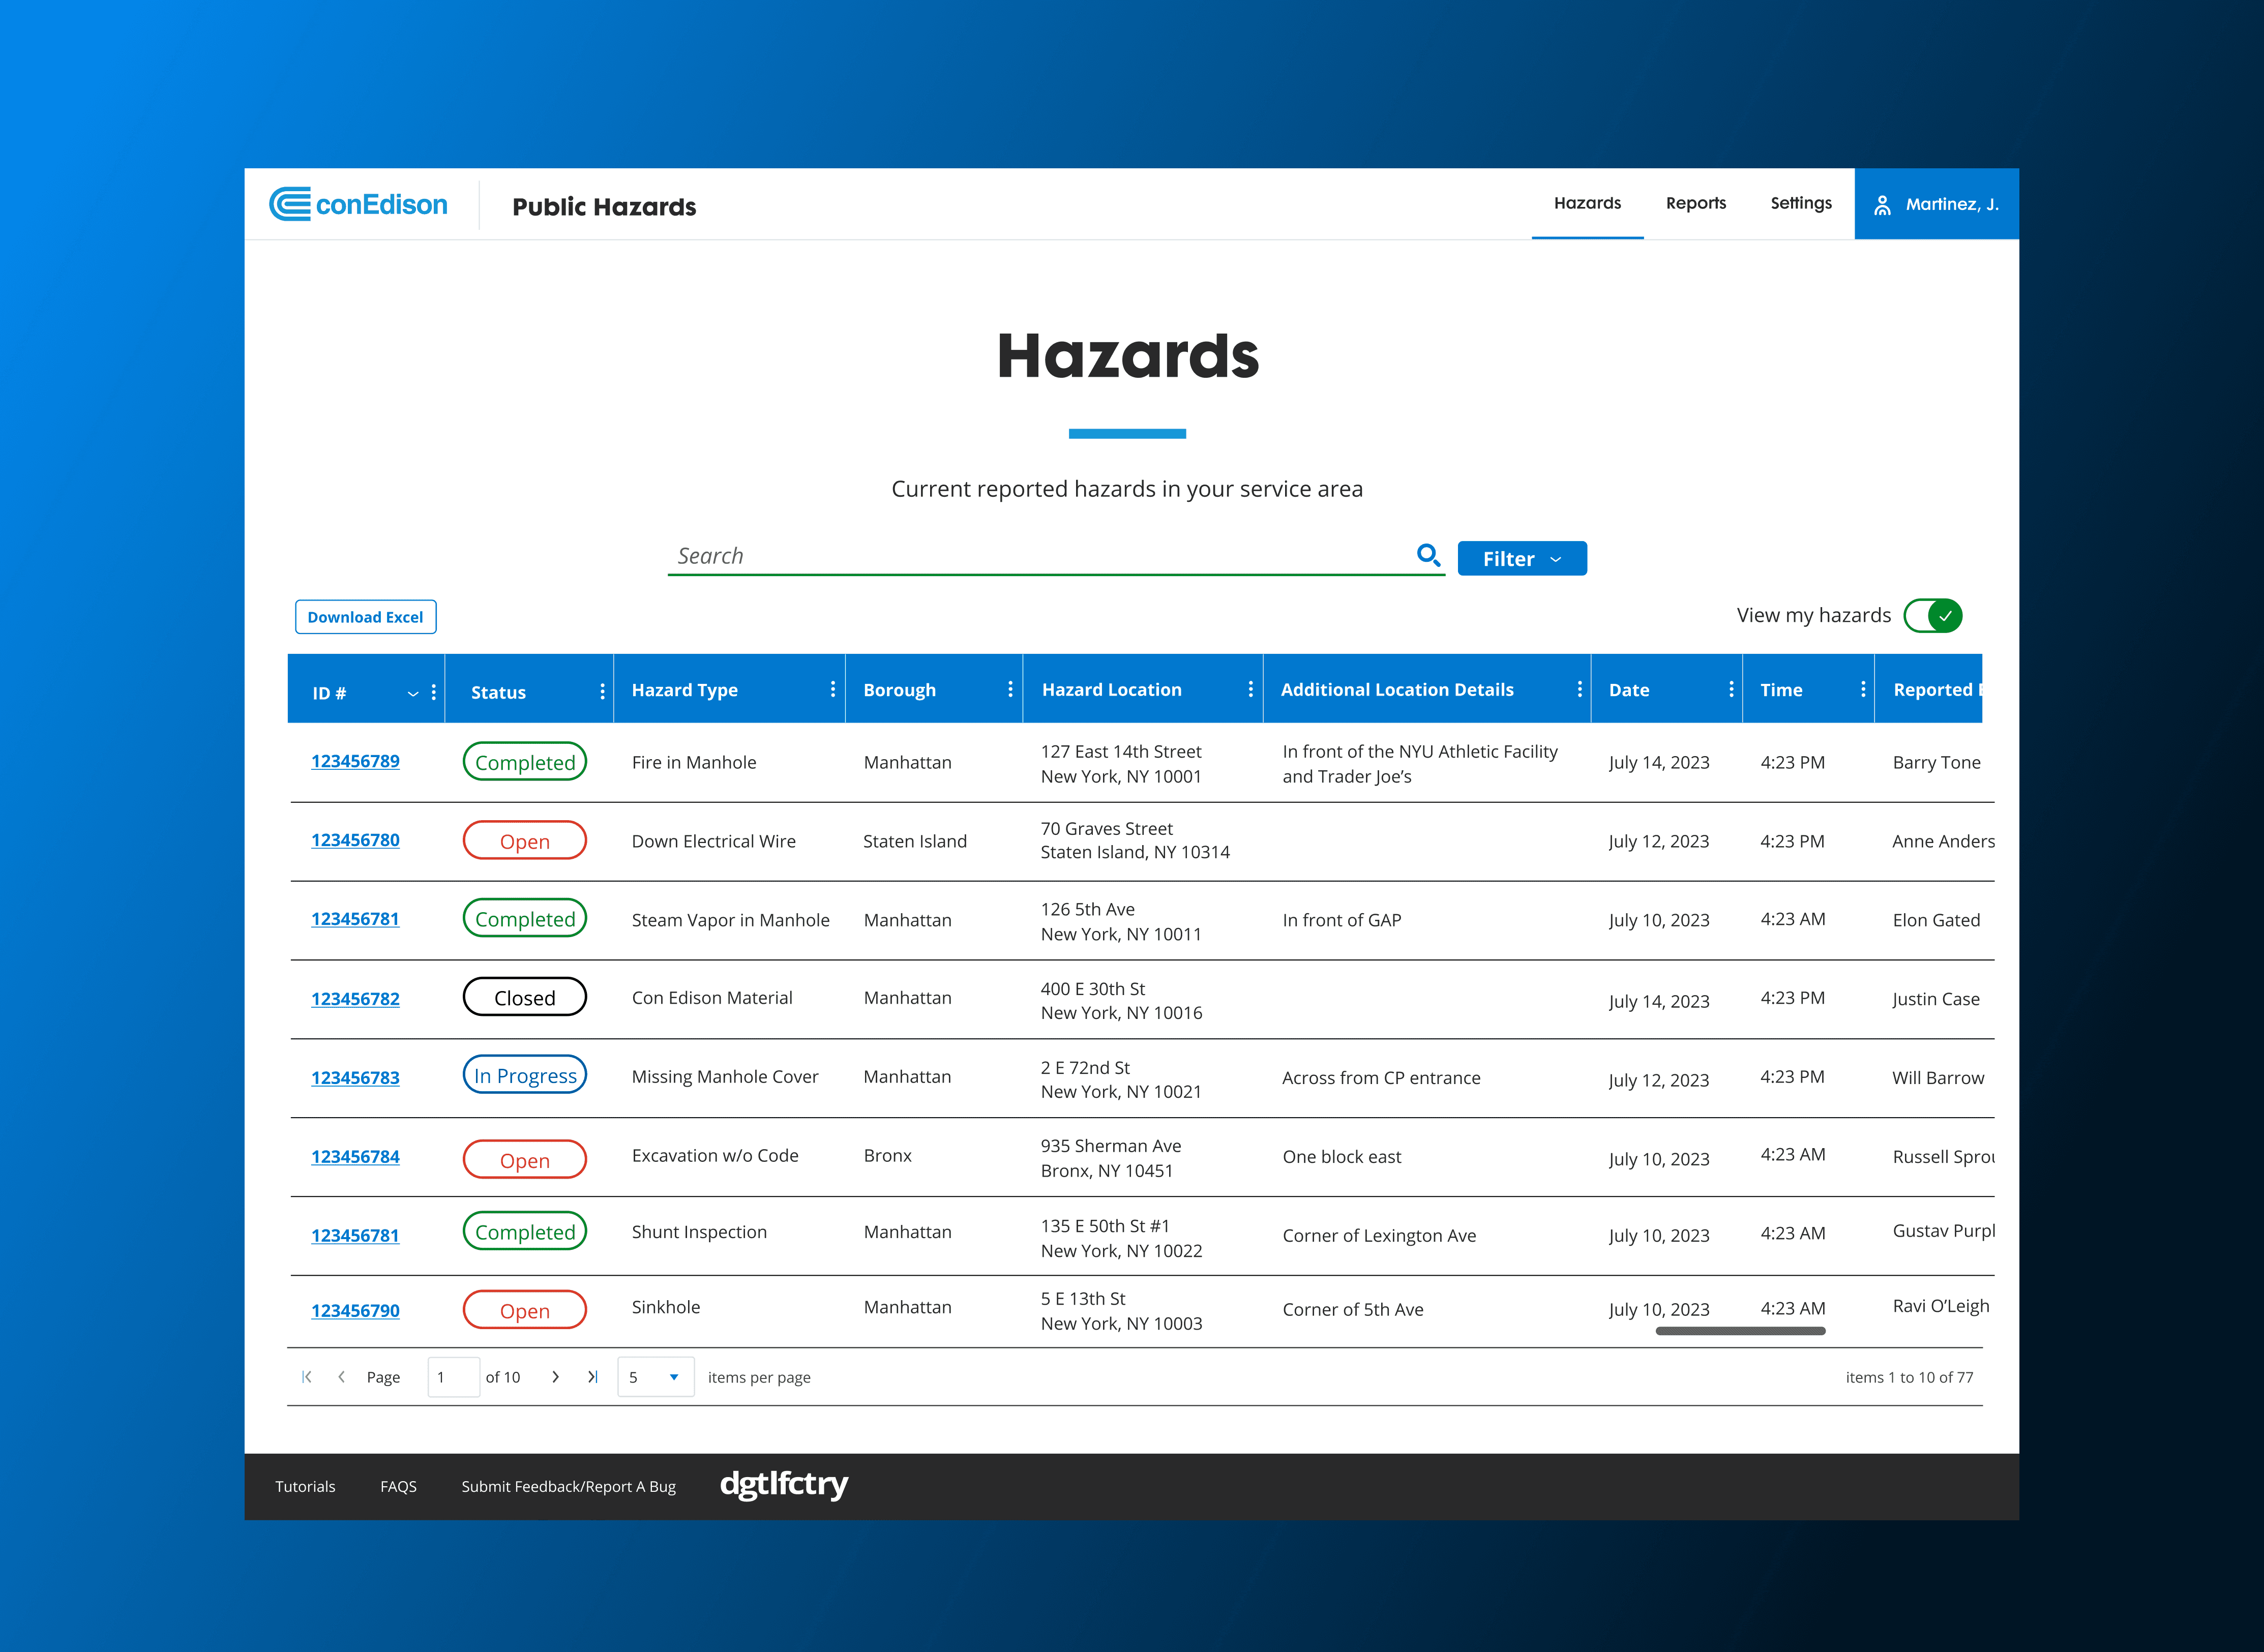
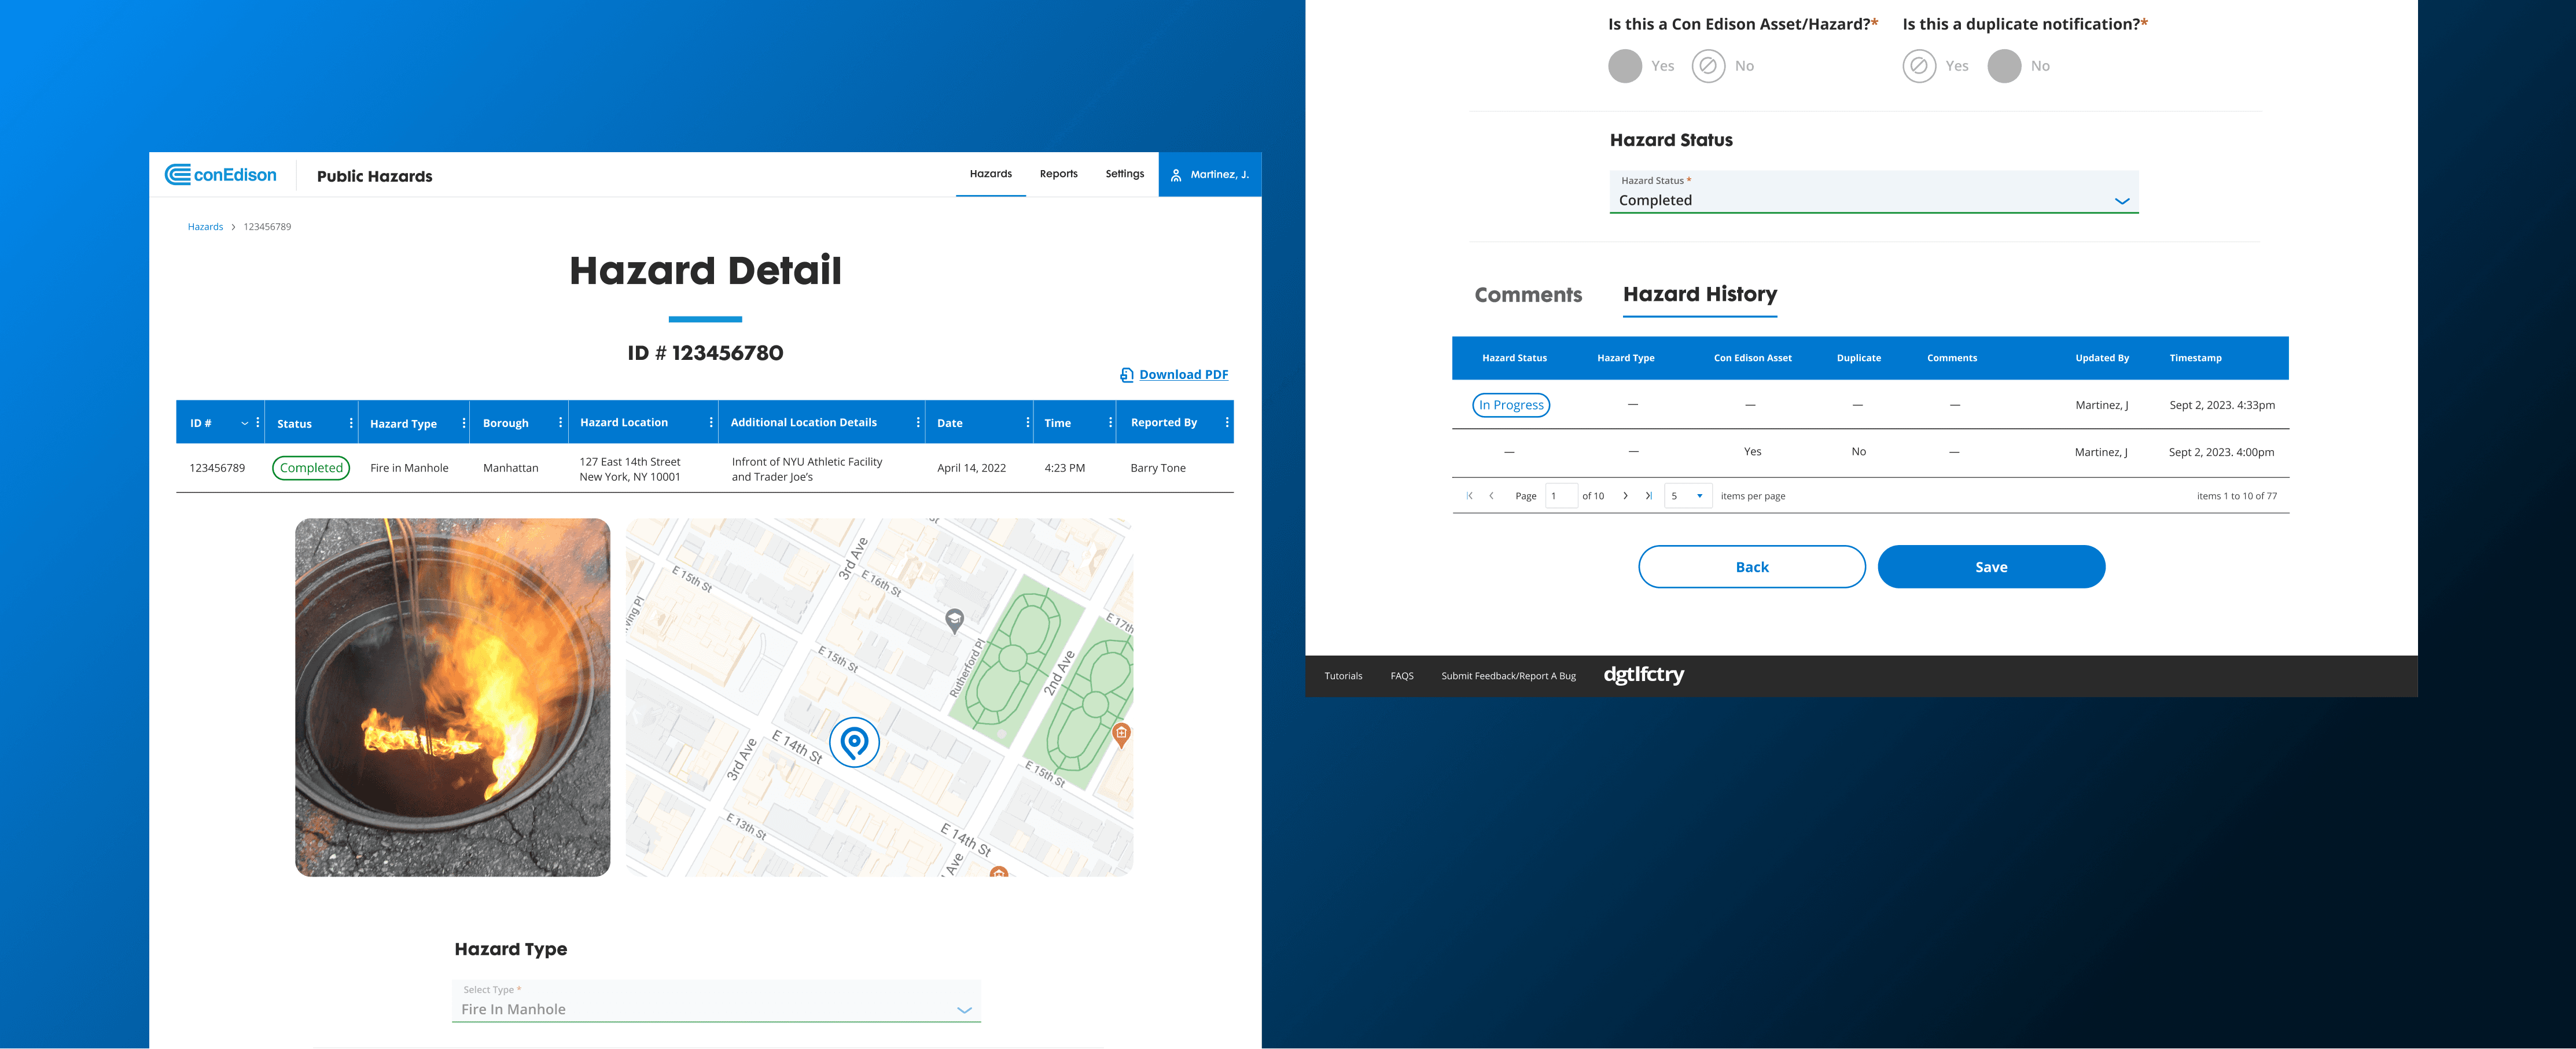
Centralized Admin Dashboard
I designed a role-based admin dashboard spanning six operational divisions, giving leaders real-time visibility, filtering, and instant notifications. To ensure the solution met operational needs, I partnered closely with Product to define requirements, facilitated alignment workshops with stakeholders from each division, and worked hand-in-hand with Engineering to refine interactions and enforce system constraints. This cross-functional approach unified previously siloed workflows, enabled proactive risk management, and established a scalable governance model for future internal tools.
Navigating Stakeholder Roadblocks
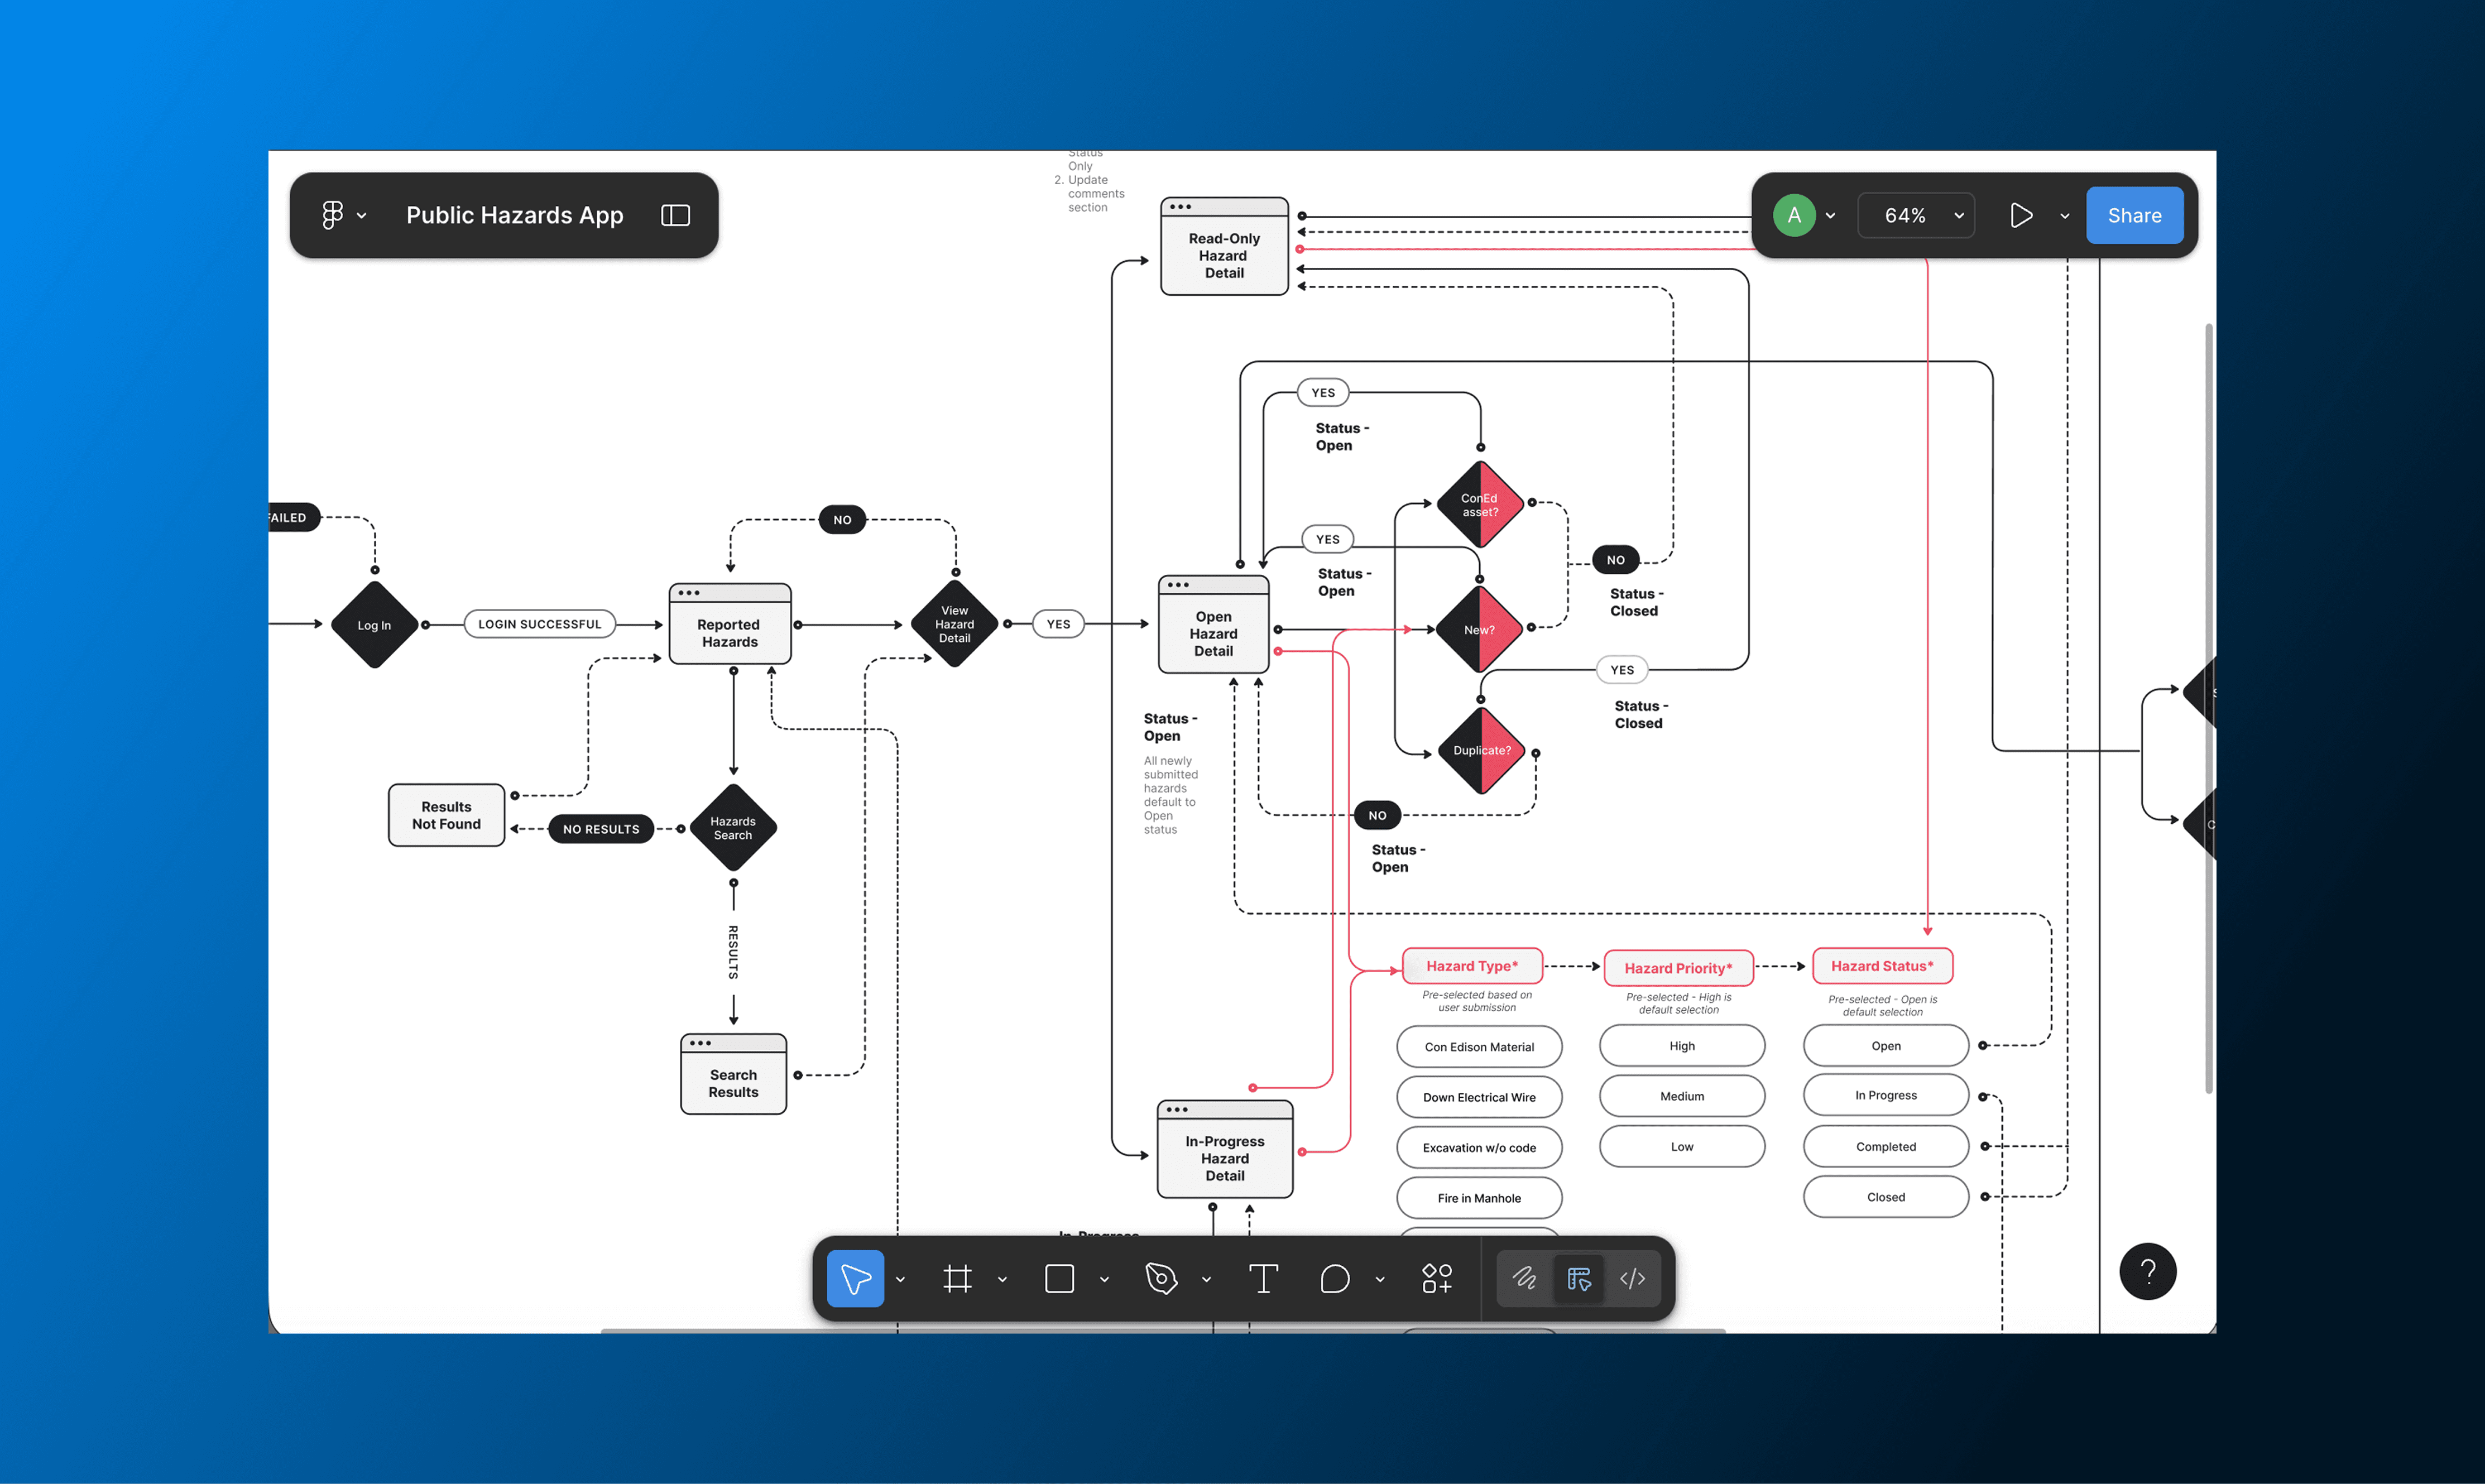
Disagreements around admin access stalled development for weeks. I facilitated a working session with product and engineering leads to align on constraints and explore access models. We landed on a configurable dashboard system that allowed admins to filter hazards and toggle visibility by borough or operational group, unblocking delivery and establishing a governance standard for future internal tools.
Critical Edge Cases
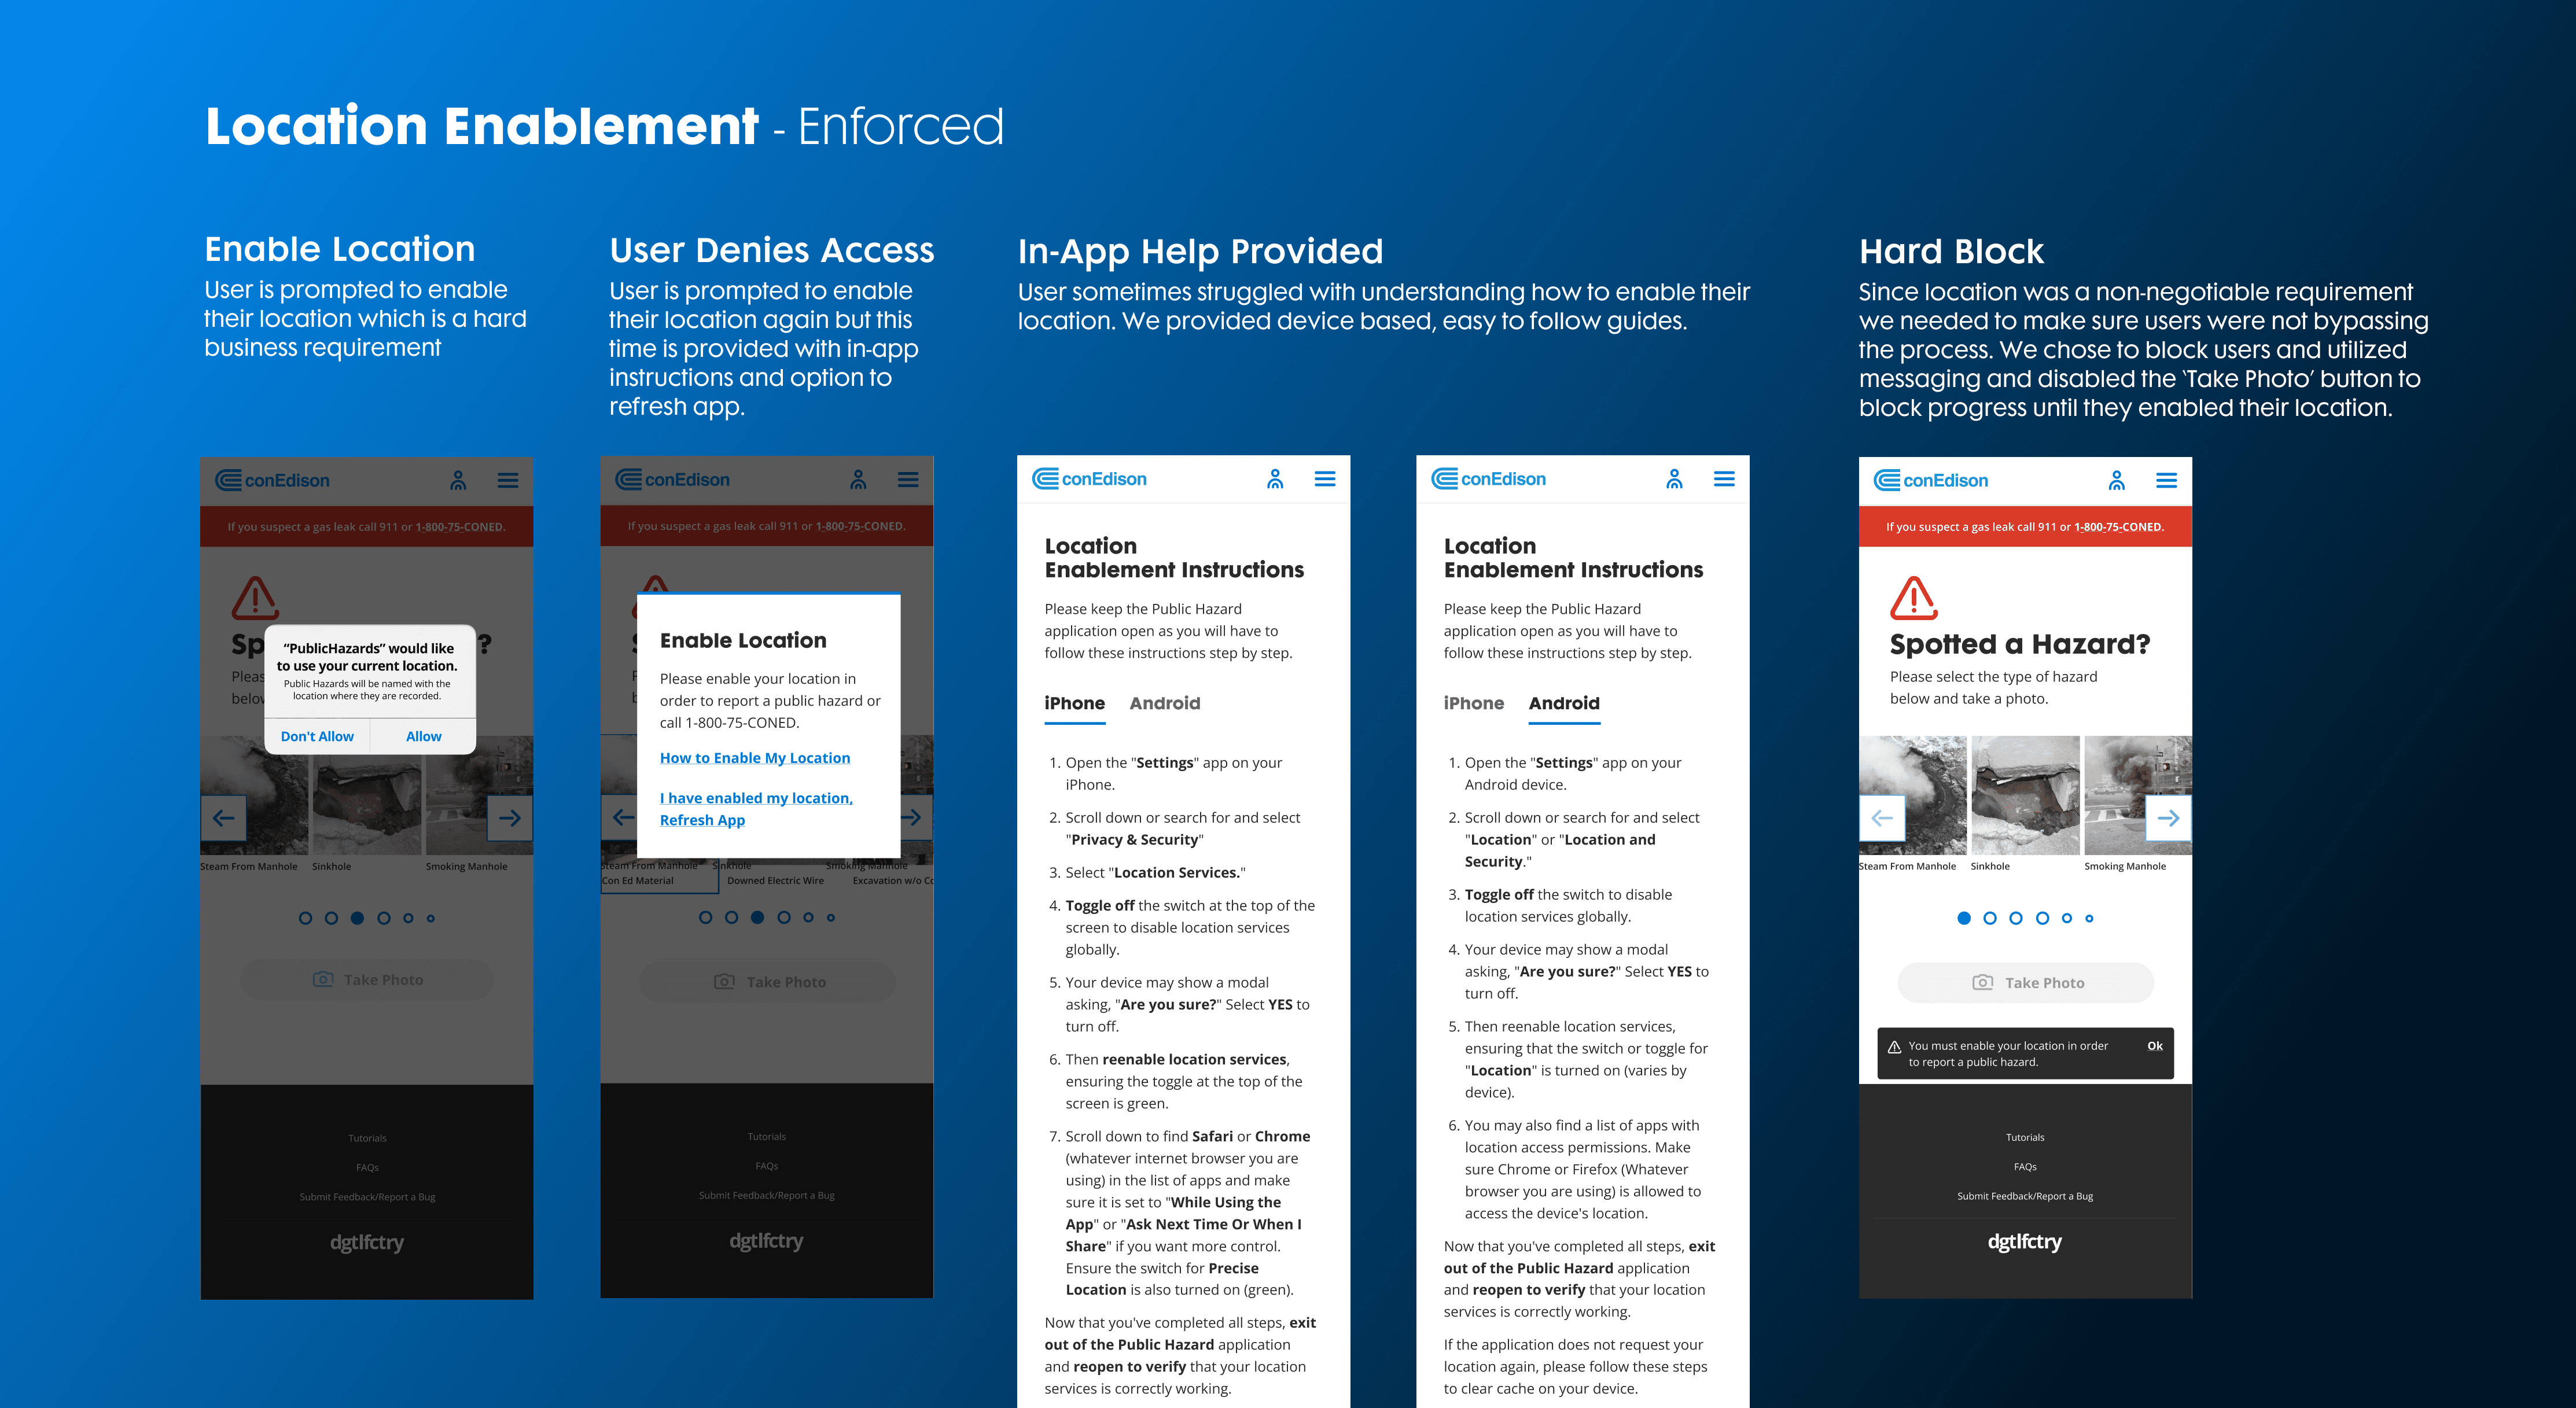
Location Enforcement
UAT testing revealed users could bypass location permissions, introducing risk. Partnering with Product and Engineering, I redesigned the end-to-end permission flow with platform-specific instructions and clear microcopy, implementing hard blocks that prevented submission until GPS was enabled. This ensured every report included accurate location data, improving routing and response time.
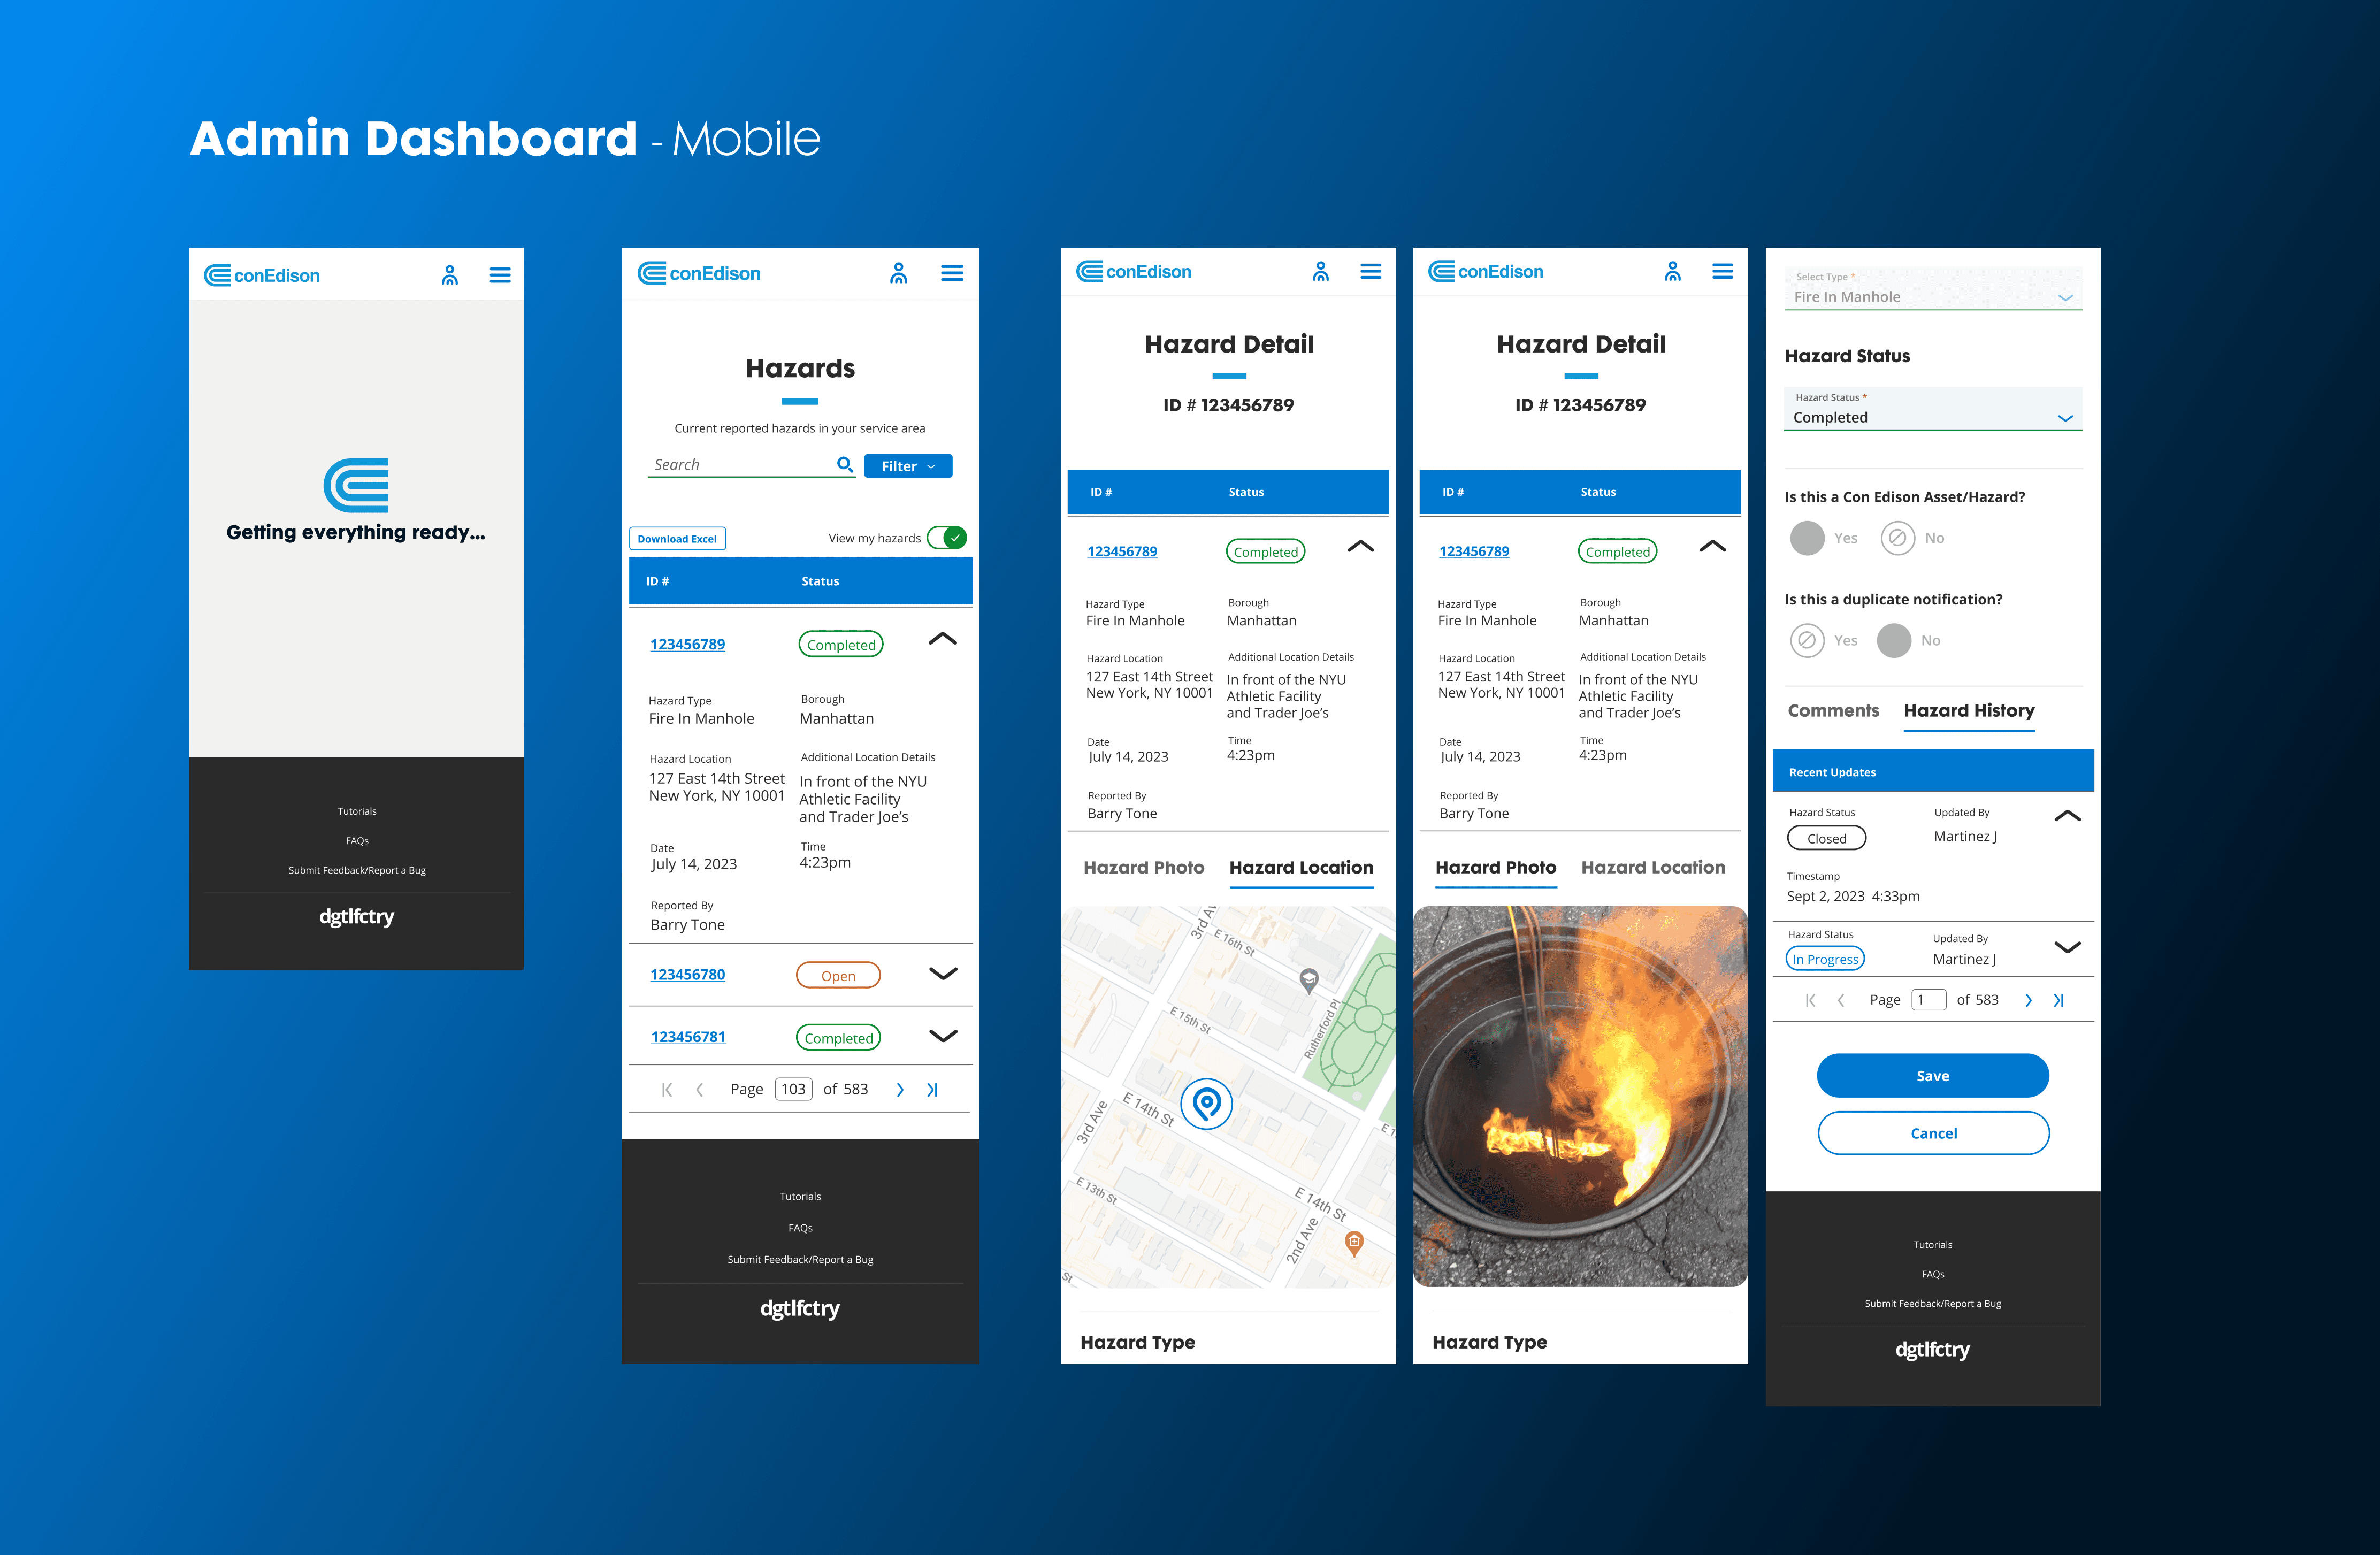
Admin Mobile Dashboard & Hazard Reporting
Initially, the admin experience was limited to hazard triage and desktop access. Operational leaders requested mobile visibility and the ability to contribute hazard reports during field visits. Partnering with Product and Engineering, I assessed business value, prioritized features with stakeholders, and extended the reporting flow for admin users without disrupting triage responsibilities. This included enabling mobile dashboard and reporting access, adding a discreet “Report a Hazard” entry in navigation, and coordinating backend updates. Close collaboration during QA ensured parity with desktop workflows. The outcome preserved workflow focus, closed a critical data gap, and created a reference pattern for future admin features.
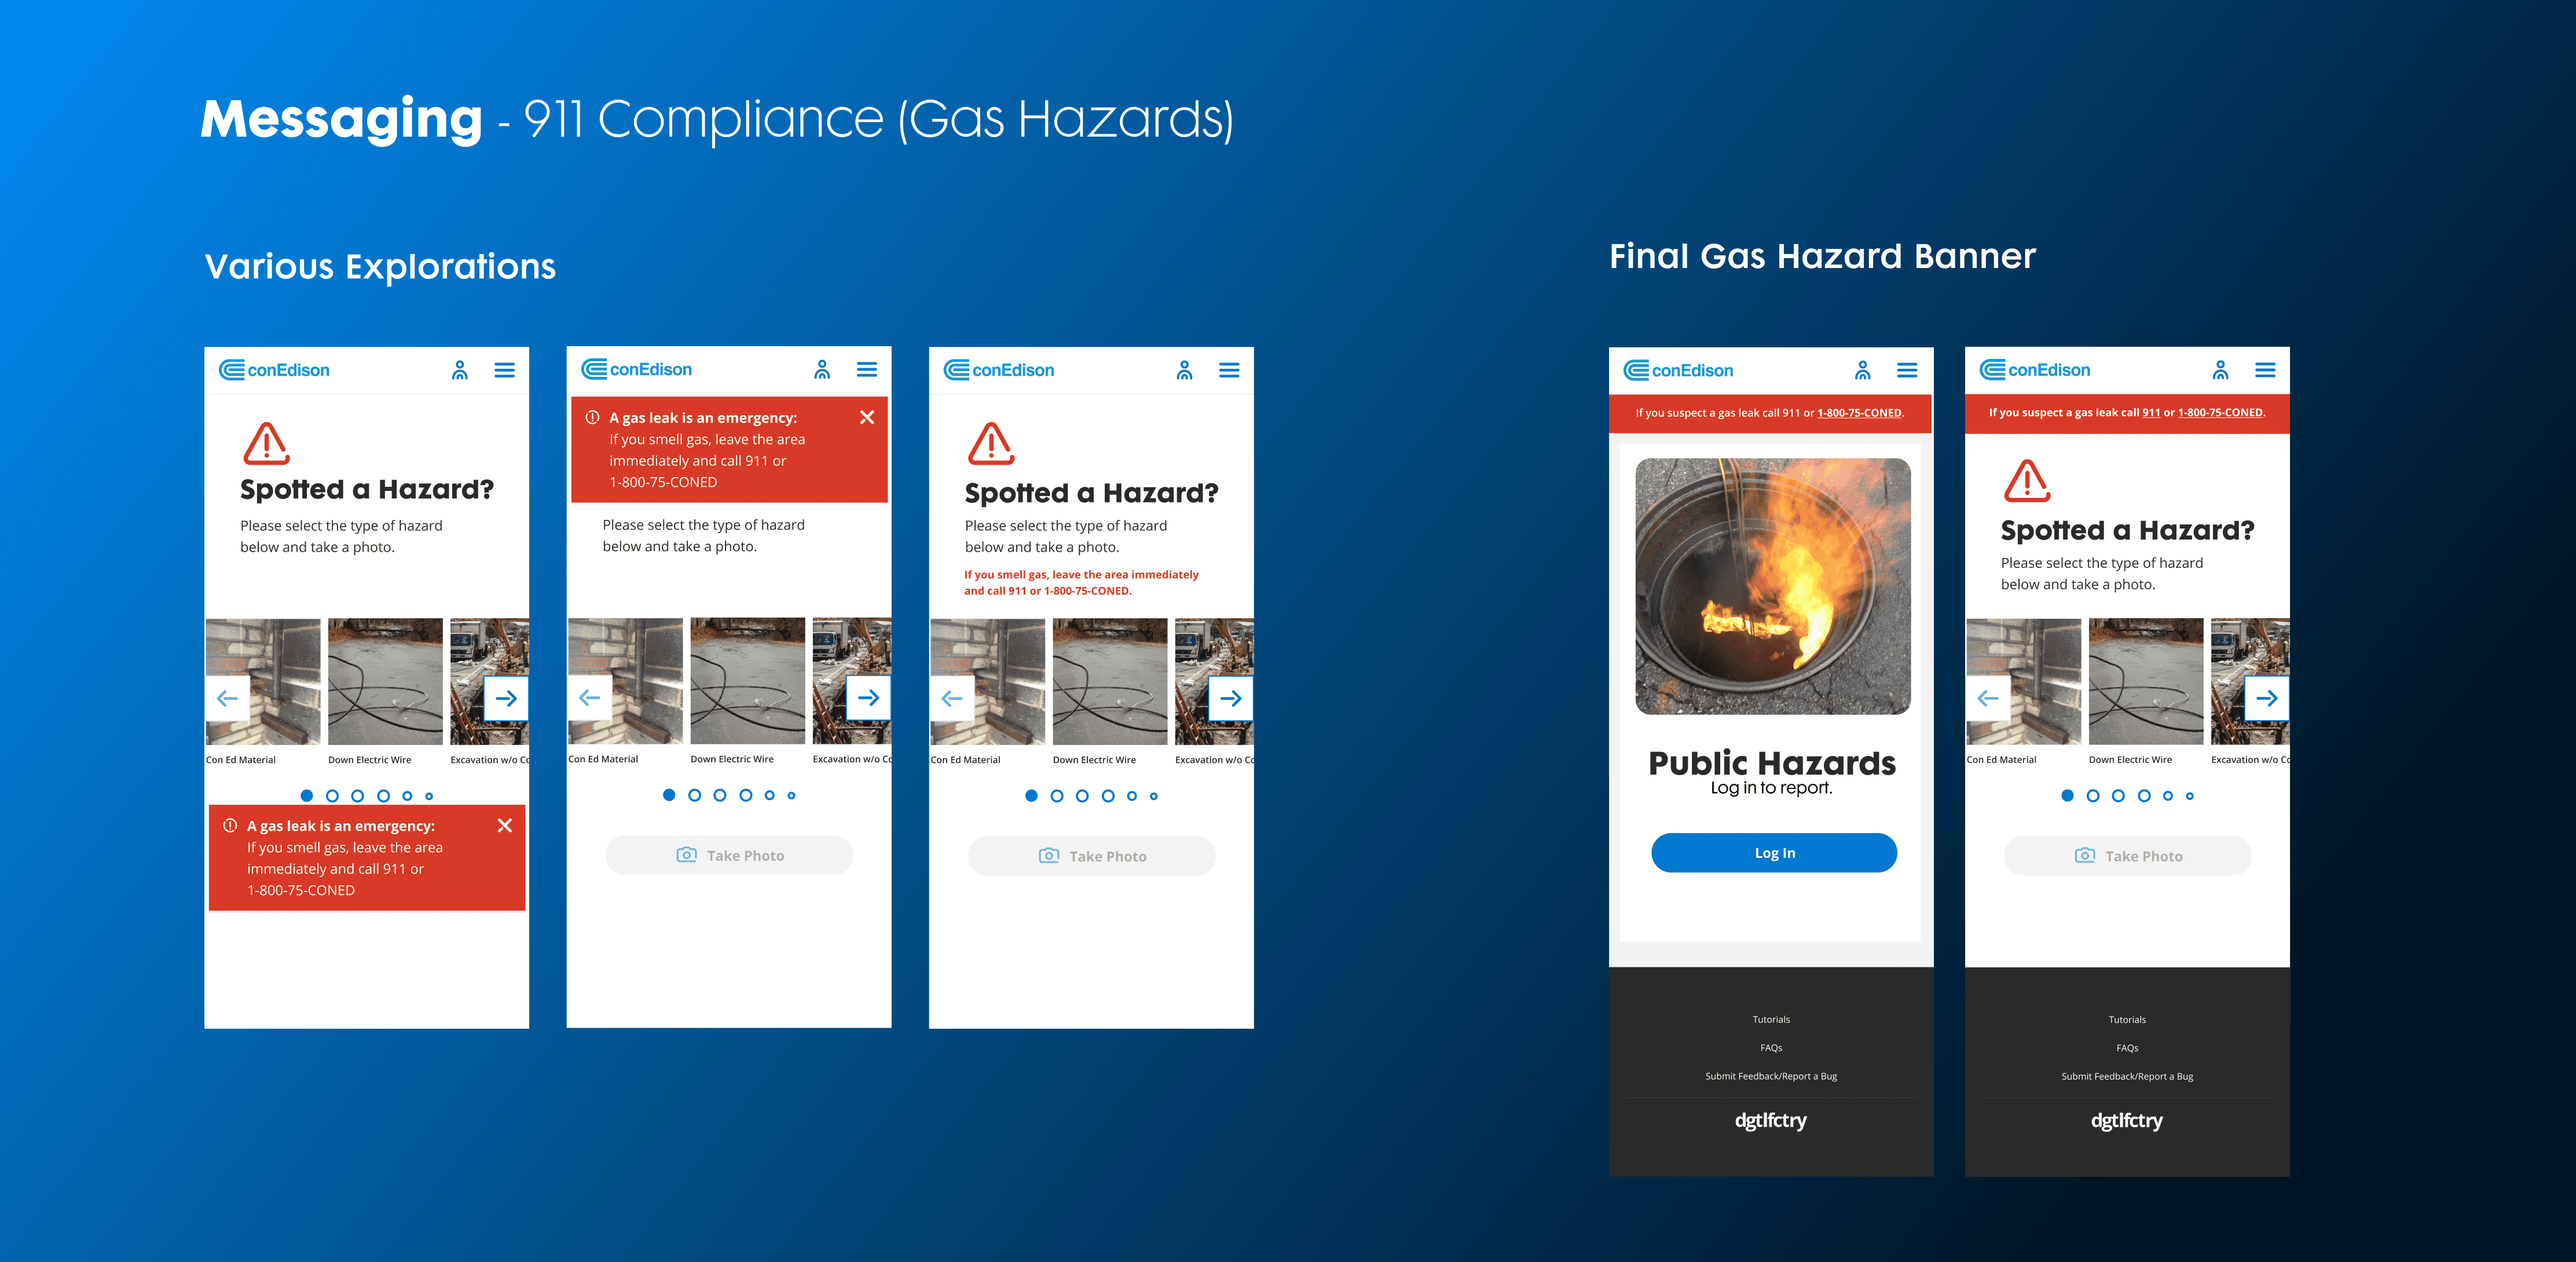
911 Compliance
A critical challenge was aligning the platform with emergency compliance requirements, particularly gas-related hazards that mandate a 911 call. There was concern that a unified app could unintentionally enable employees to bypass required safety protocols. Partnering with safety, compliance, product, and engineering, we resolved the tension through interaction design—triggering a non-dismissible 911 prompt when gas hazards were selected, with messaging co-authored for regulatory accuracy. This preserved mandatory safety workflows while maintaining a single, trusted platform across divisions.
Driving Cross-Division Adoption
Designing the product was only half the battle—employees had to want to use it. During usability testing, a common theme emerged:
"This is a great app, but how will users know it exists?"

Partnering with Product, Corporate Affairs, and Training, I helped lead a multi-channel adoption strategy to ensure the platform was visible, credible, and understood across the organization. Because this was the Digital Factory’s first highly visible, employee-facing application, we intentionally incorporated Digital Factory branding to clearly signal that the tool was official, supported, and safe to use—distinguishing it from prior internal experiments and accelerating trust.
To reinforce adoption, I collaborated with Corporate Affairs to design digital elevator screen content that ran across headquarters for two weeks ahead of launch, created visual one-sheets and SharePoint content for control centers across NYC, and worked with training leads to integrate the tool into onboarding and recurring safety refreshers. Adoption was further reinforced through promotion on the company-wide monthly safety call, ensuring consistent visibility and executive support.
Result: 85–90% adoption within the first two weeks—an outcome rarely achieved with internal enterprise tools.
Design System Evolution Highlights
Mobile-First Data Table
During usability testing, it became clear that the existing mobile data table pattern wasn’t providing users an optimal experience on mobile devices. The default approach required users to swipe horizontally through multiple columns to view details—slow, error-prone, and nearly impossible in the field.
I challenged this pattern and reimagined it for small screens. Drawing inspiration from accordion UI structures, I designed a mobile-first table with expandable rows that surfaced the most critical information upfront. Users could tap to reveal additional fields without horizontal scrolling, significantly improving speed and clarity.
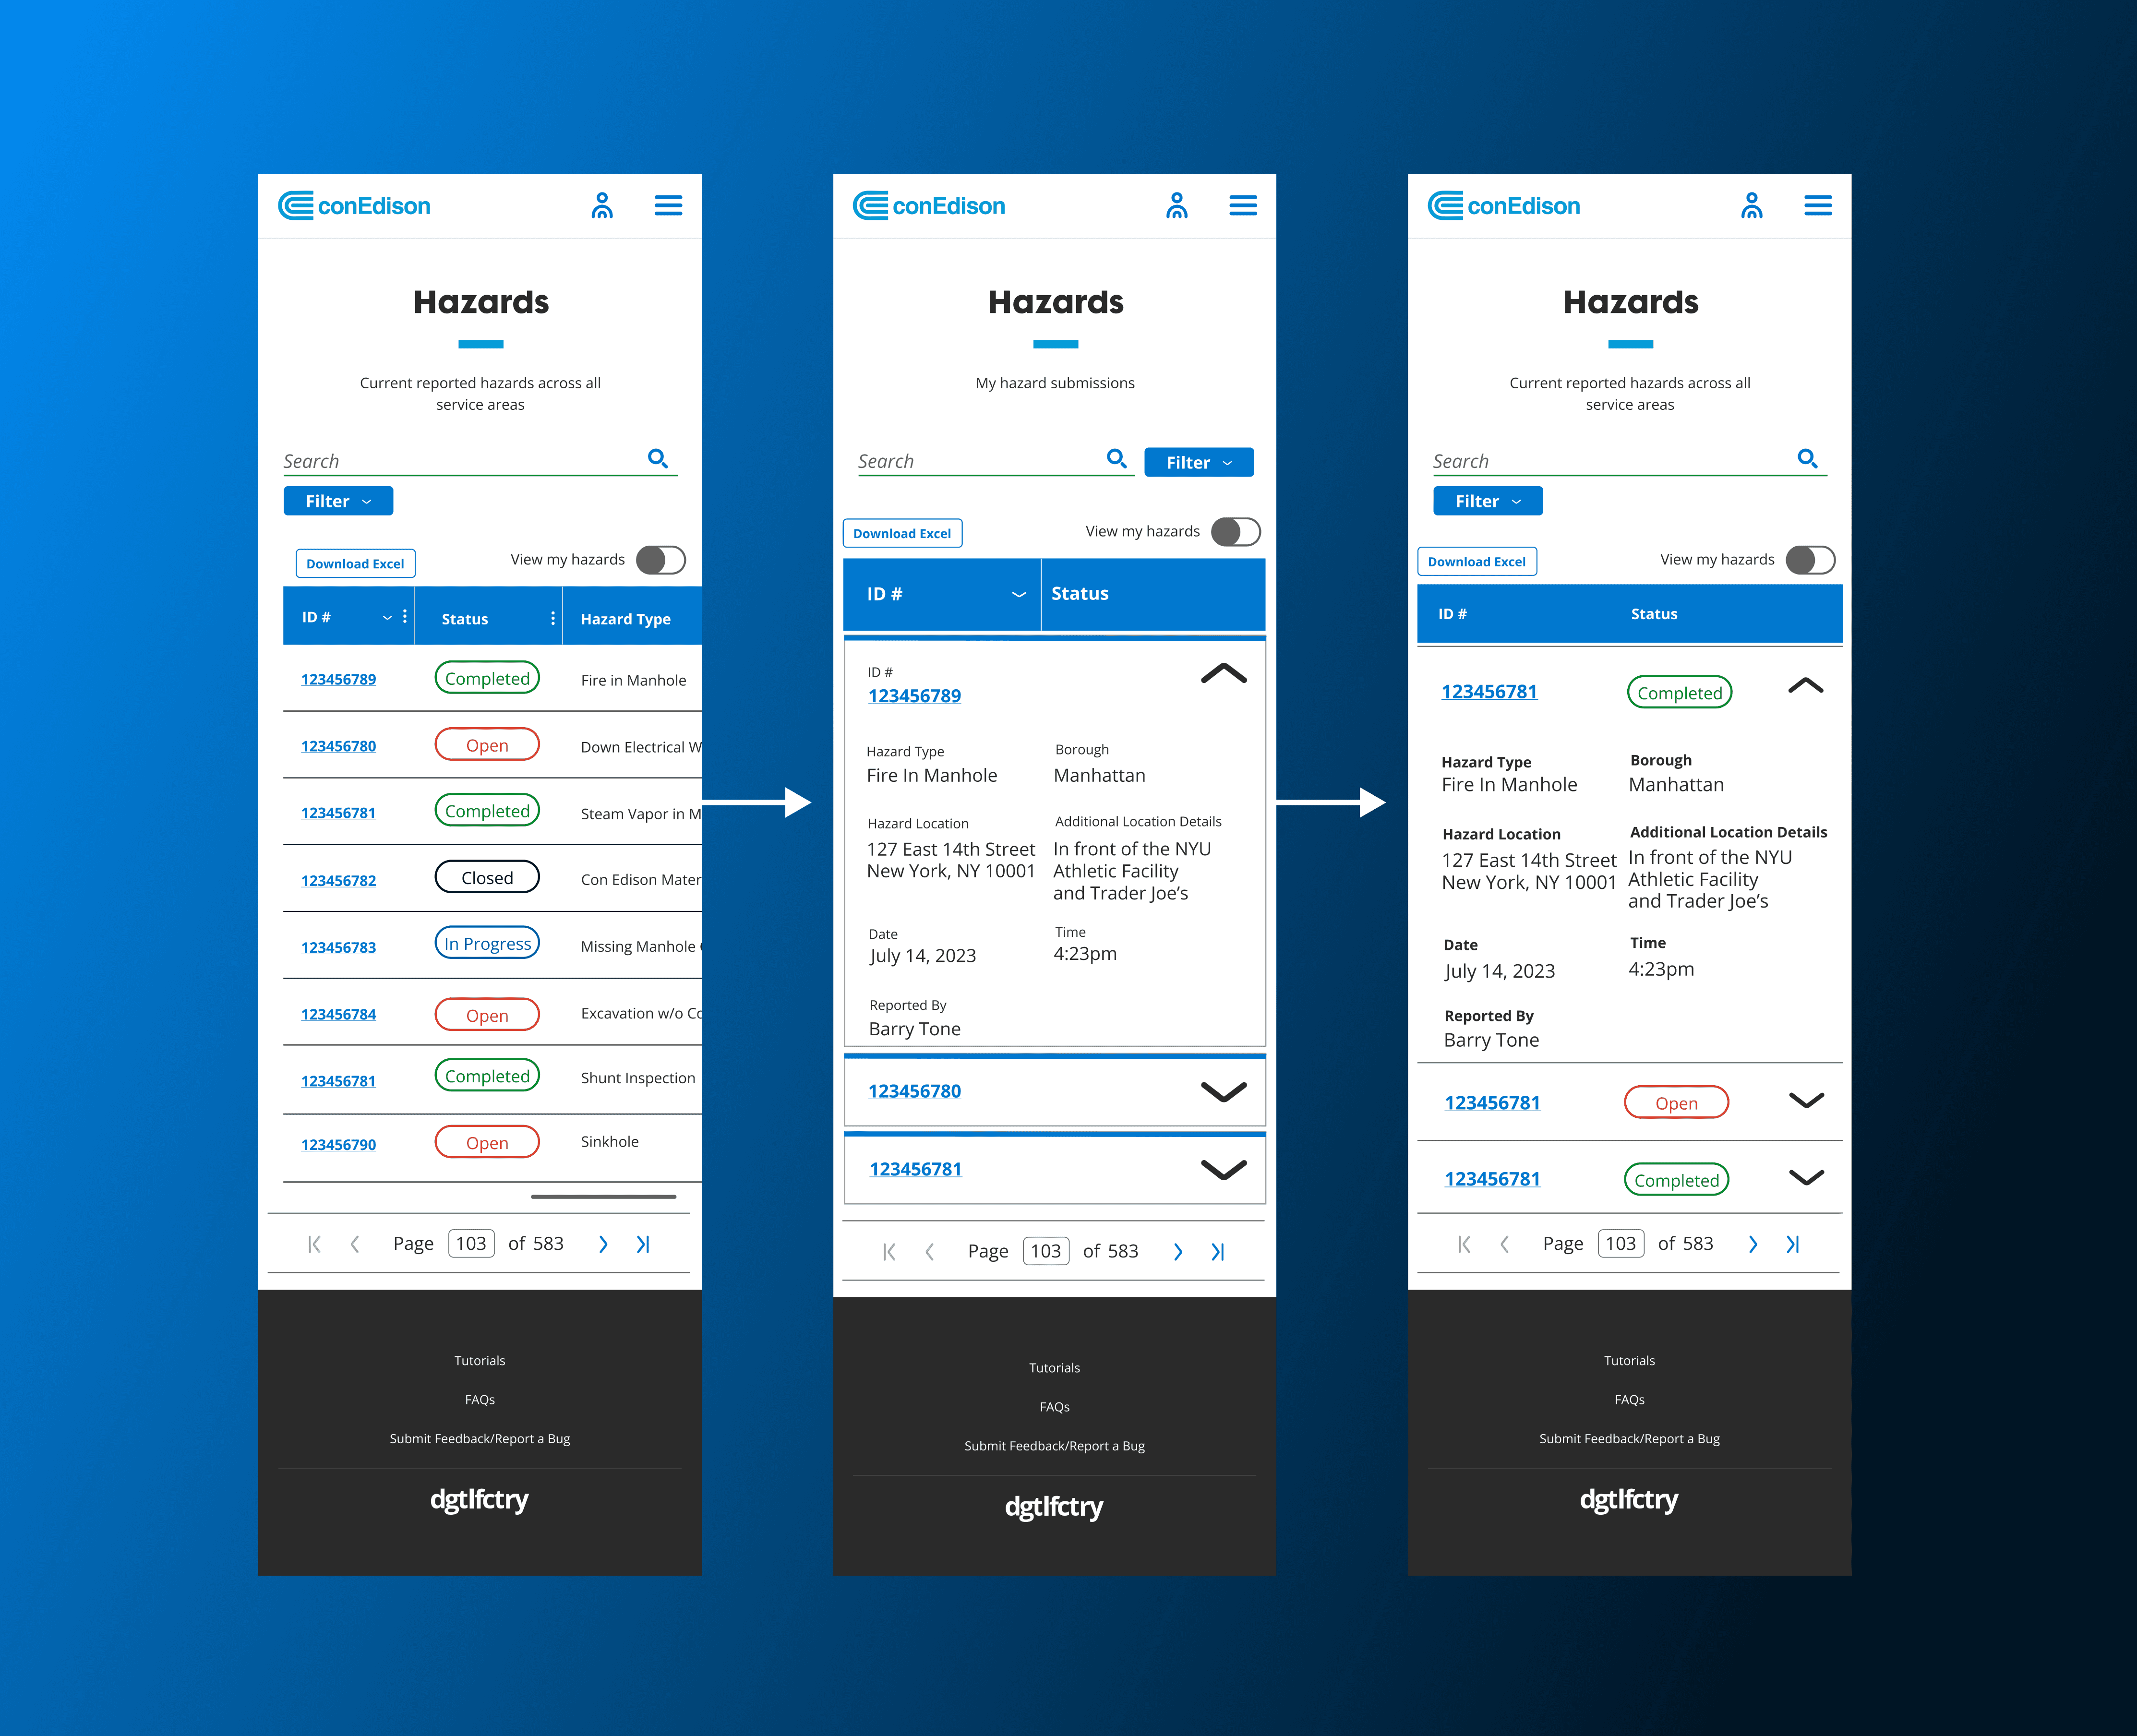
As Design System Lead on the Digital Factory team, I contributed the pattern back into the enterprise design system—allowing other product teams to adopt the solution and improve mobile usability across the ecosystem.
Image Carousel
Speed and accuracy were both non-negotiable for this citywide reporting experience—public safety depended on it. I led the exploration of interaction models for the “Select a Hazard” flow, pairing UI experiments with speed and usability testing to understand how quickly and confidently users could identify the hazard they were seeing in the real world.
I explored dropdowns and radio buttons first, but both introduced unnecessary friction and slowed users down in moments where every second mattered.
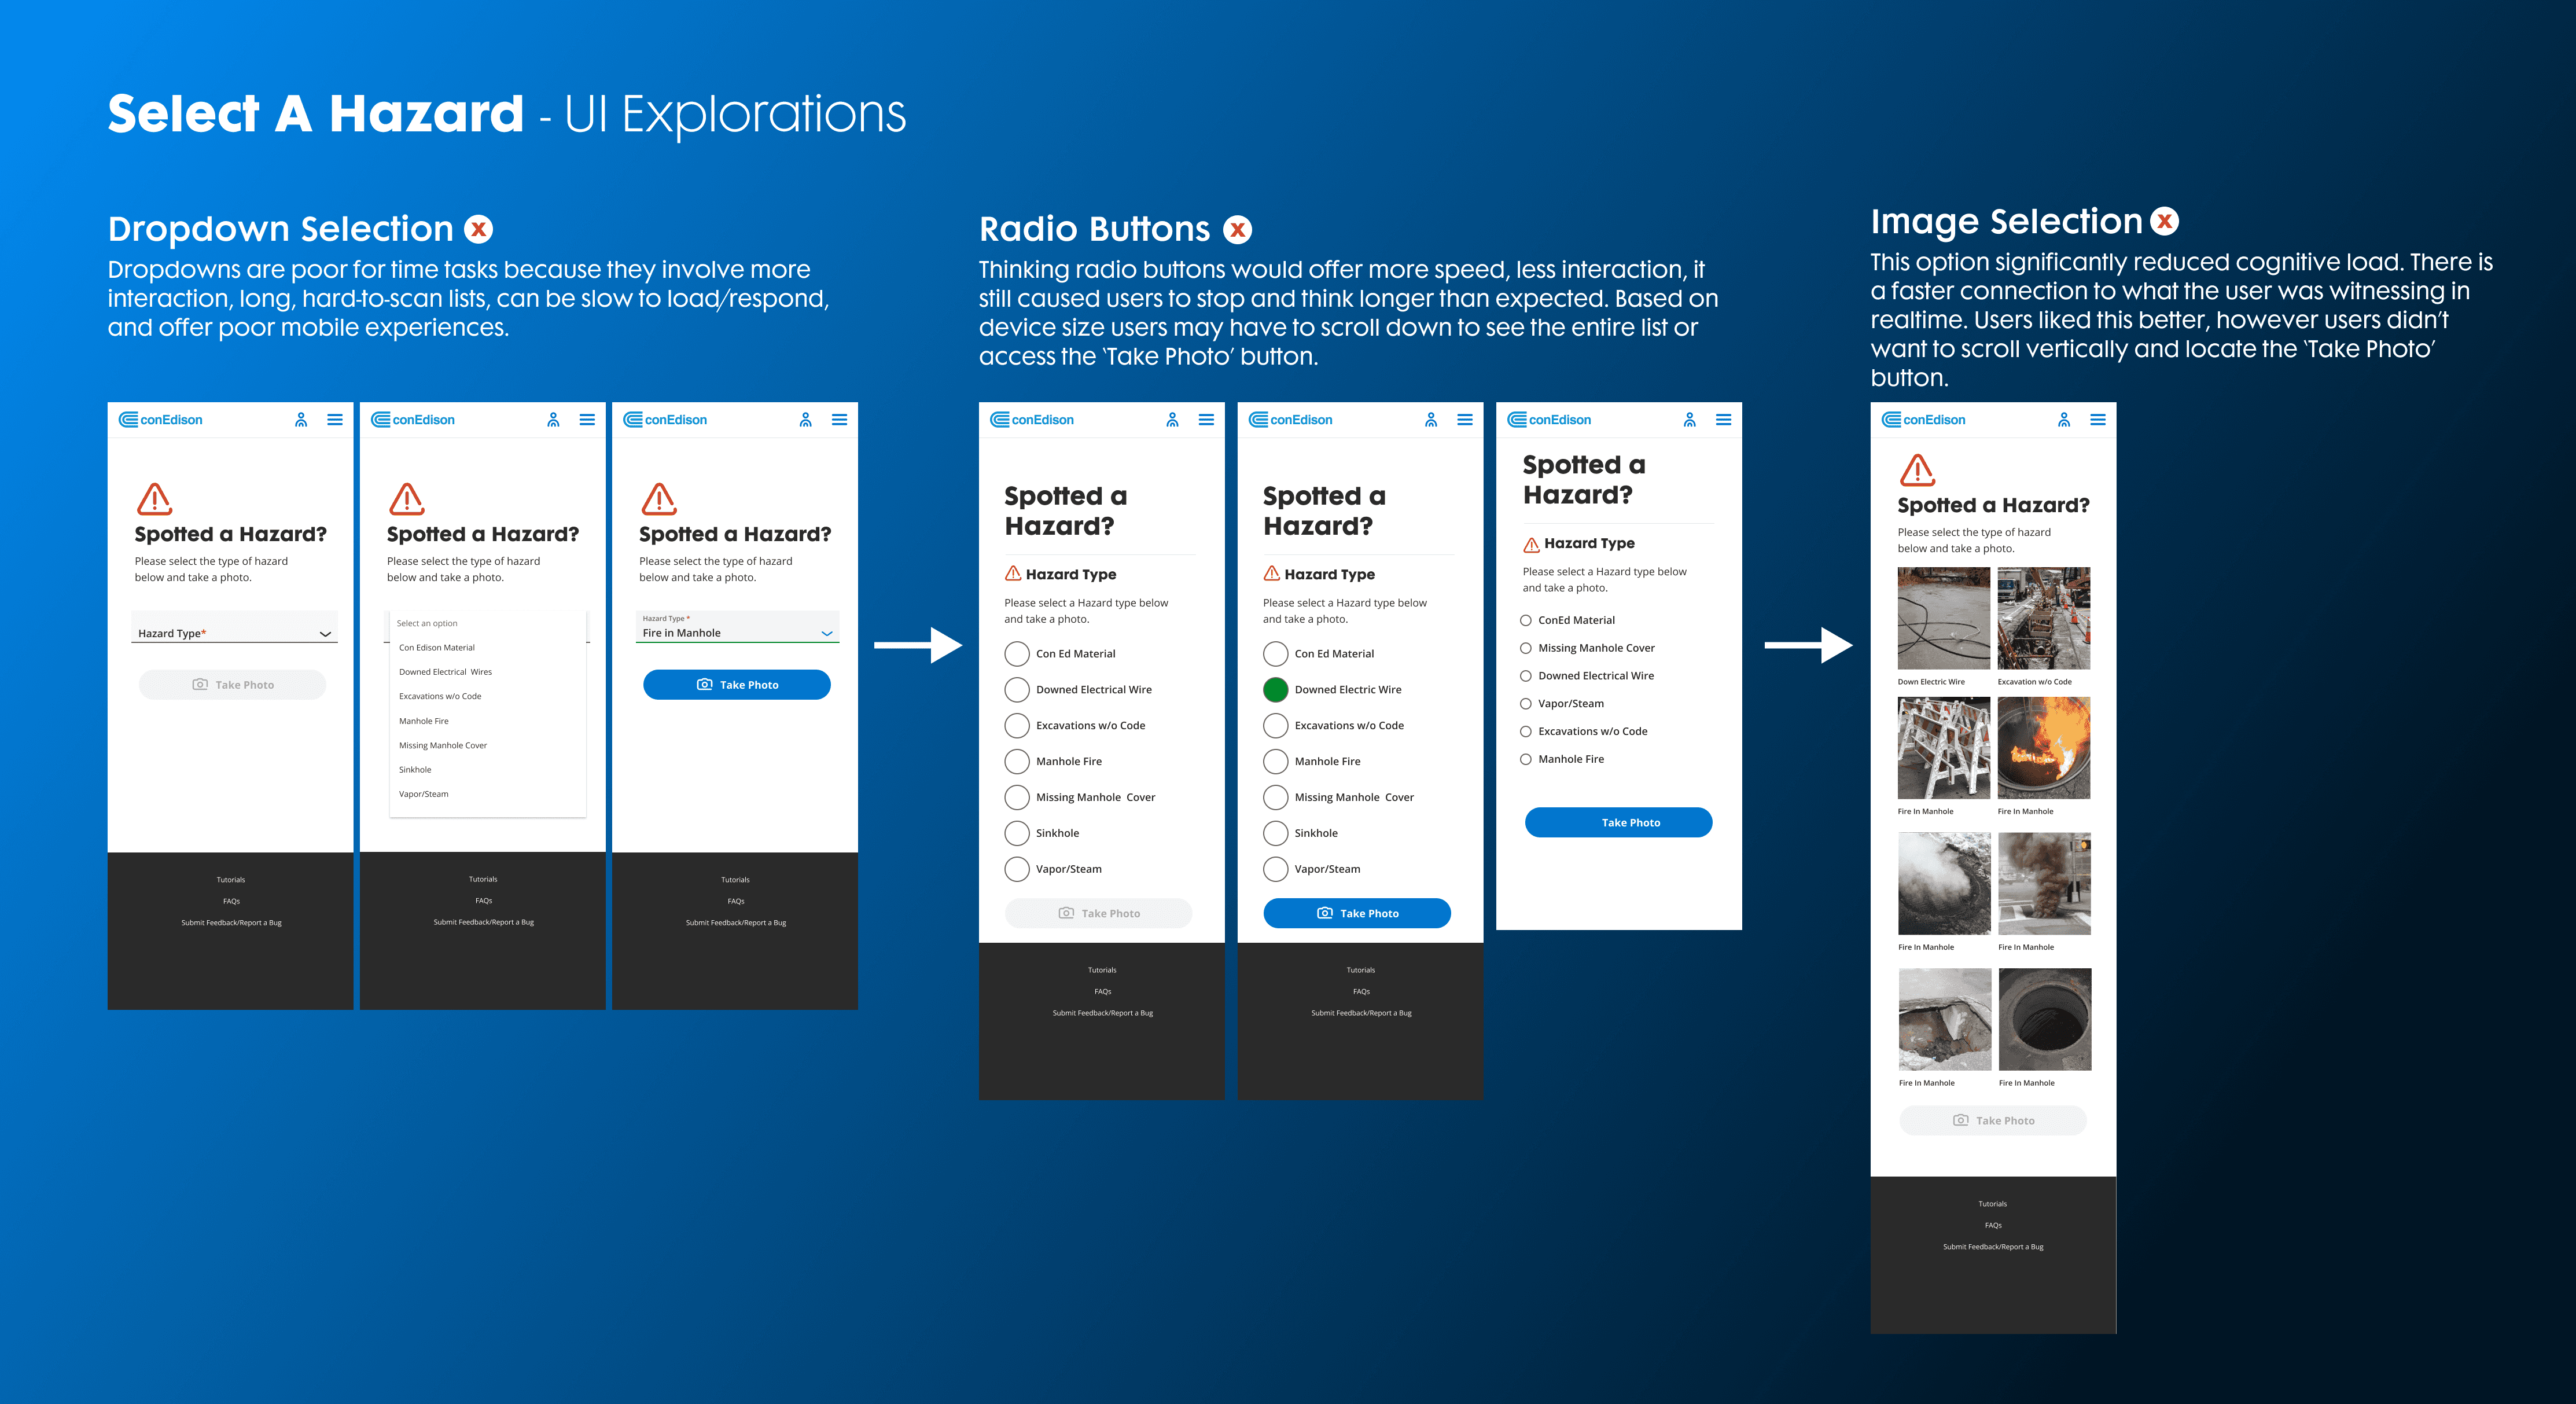
An image-based selection approach ultimately performed best, reducing cognitive load and helping users immediately connect what they were witnessing to the correct hazard type with minimal interaction.
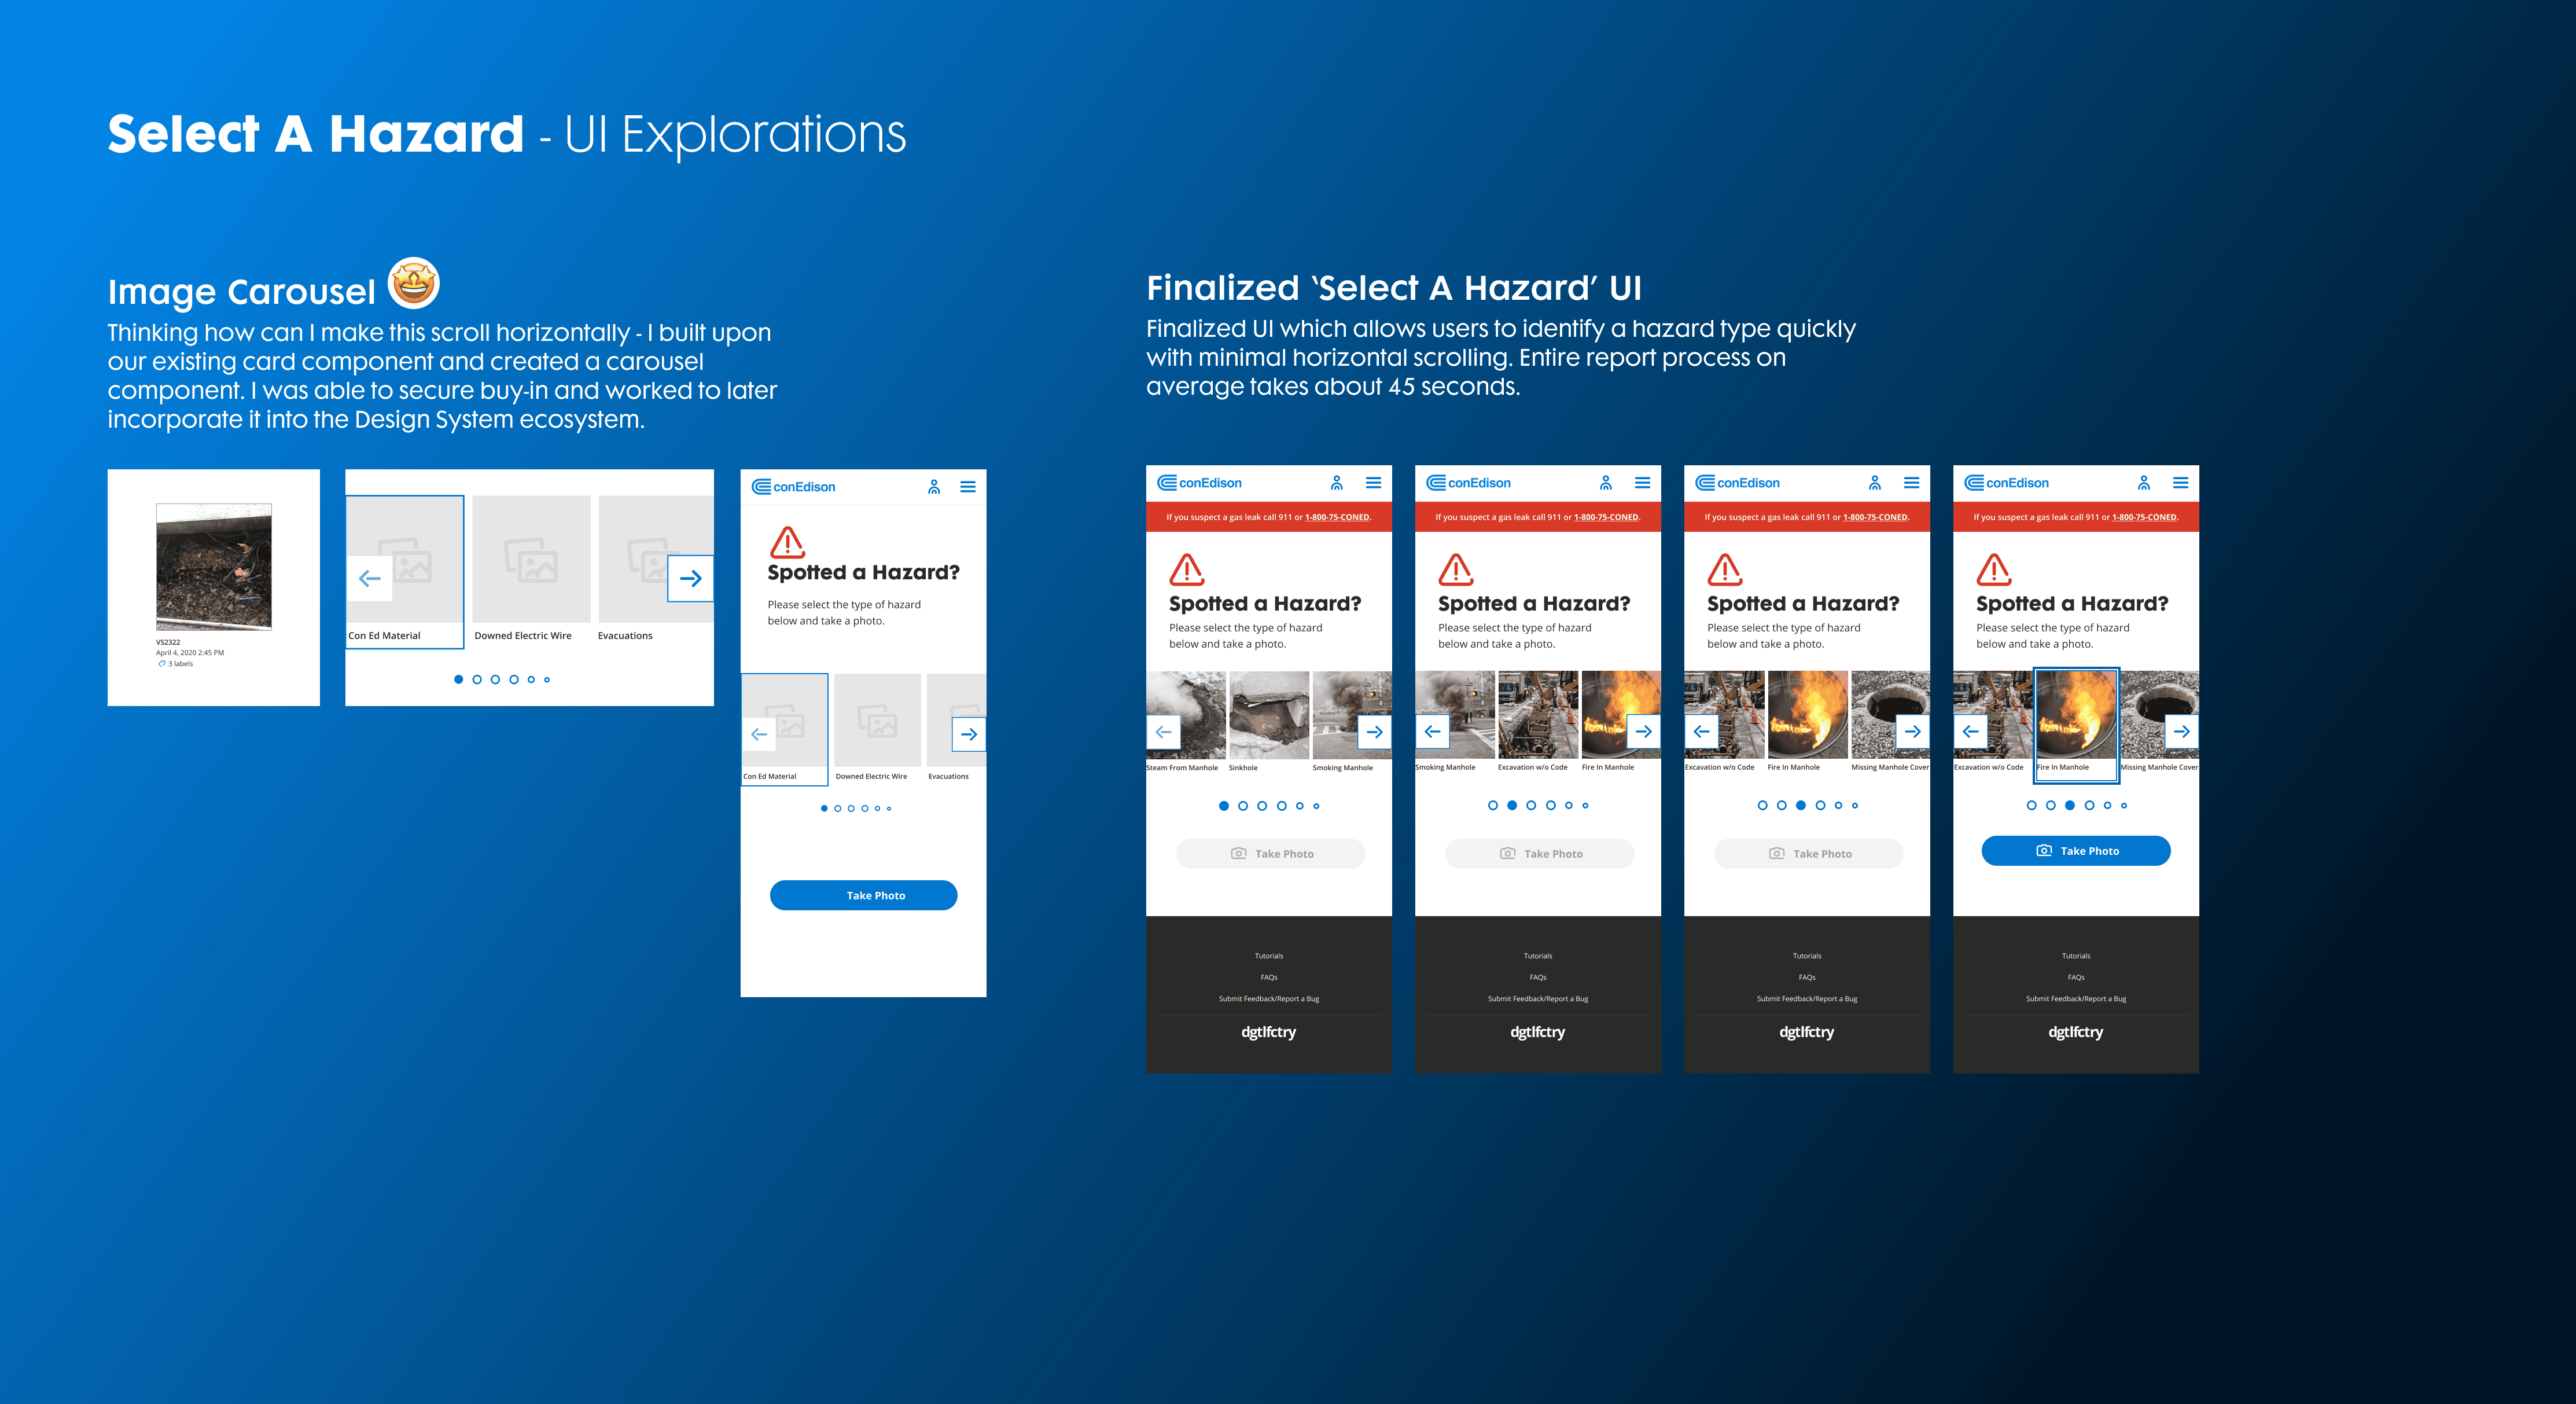
This work meaningfully reduced time-to-report while improving accuracy and user confidence. It also extended beyond this single flow—this exploration led to the creation of a new carousel component that was later incorporated into the design system, establishing a scalable pattern used across multiple applications.
What Changed Because This Shipped
Hazard reporting went from hours to under a minute.
Employees began reporting hazards proactively, and leaders leveraged dashboard data to identify trends and prevent issues before they occurred.
The system became a catalyst for data-driven safety—something no hotline could ever deliver.
Phase 2
Following the MVP launch, I partnered with product leadership to define the long-term roadmap, focused on scaling impact and future-proofing the platform.
This included exploring AI and ML capabilities for automated hazard detection, voice-based reporting to support hands-free use in high-risk environments, and a customer-facing version to extend reporting to the public. We also planned features that allowed employees to track the status of reported hazards, incentive models to drive sustained adoption, and STAR system integration for automated ticket creation, tracking, and operational follow-through.
AI-Assisted Reporting Strategy (Not Shipped)
AI-Assisted Reporting
As adoption grew, we began exploring what the next evolution of hazard reporting could look like. The challenge was clear: while teams were eager to leverage automation, safety officers and compliance leaders were cautious of anything that might “black-box” critical decisions. Any future vision needed to accelerate reporting without compromising human judgment, auditability, or regulatory requirements.
With that balance in mind, I designed a Phase 2 concept that uses AI and ML to remove friction—not responsibility.
Reimagining Reporting: From Manual Inputs to Photo-First Intelligence
In the current system, users manually select hazard types and rely on GPS permissions for location accuracy. While effective, these steps still introduce friction—especially in high-stress or hazardous environments.
The future flow begins with the simplest possible action:
Snap a photo → the system does the heavy lifting.
1. AI-Assisted Hazard Identification
Using modern on-device and server-side computer vision models—the same class of models used to detect damaged infrastructure, classify construction hazards, and identify utility defects—the system analyzes the photo and surfaces the most likely hazard type, such as sparking cable, steam release, manhole conditions, or equipment damage.
Rather than replacing decision-making, the model acts as a guide. Users always review and confirm the suggested hazard, directly addressing enterprise concerns around AI “deciding” safety outcomes.
2. Location Auto-Detection Without GPS Dependence
One of the most persistent friction points in Phase 1 was ensuring employees enabled location services. While non-negotiable for operational accuracy, GPS was technically brittle and often misunderstood in the field.
Phase 2 removes that burden.
When a photo is taken, the system automatically:
Extracts coordinates from EXIF metadata
Falls back to visual geo-estimation models trained on NYC streetscapes when metadata is unavailable
Prompts the user to confirm a mapped suggestion in indoor or low-signal environments
The result is accurate, reliable location data—even when GPS is disabled, inconsistent, or unavailable.
This directly addressed one of the enterprise’s biggest concerns:
“Can we trust automated location detection?”
With layered signals and explicit user confirmation, the answer became yes.
3. Human-in-the-Loop: A Non-Negotiable for Safety Compliance
Across every conversation with safety and compliance leaders, one principle was consistent: automation can assist—but never replace—human judgment.
To honor that, the conceptual flow preserves human oversight at every critical step:
Photo captured →
AI suggests hazard type and severity →
System adds location context →
User reviews and confirms →
Submit
Nothing is auto-submitted.
Nothing is hidden.
The user remains firmly in control.
This human-in-the-loop model became the foundation for early stakeholder buy-in, particularly among divisions historically cautious about technology-driven safety workflows.
Why This Matters
AI isn’t introduced for novelty—it directly addresses real problems observed across thousands of hazard reports:
Employees operate in noisy, high-stress environments
Faster reporting materially impacts safety and response time
Manual inputs introduce inconsistency and error
GPS permissions are unreliable in the field
Compliance teams require transparency and traceability
Phase 2 builds on what’s already working, while deliberately removing the friction points uncovered through real-world use—without compromising trust, accountability, or safety.
Credits
Design Lead: Amanda Whelen
Product Owner: Nawang Jimba
Analysts: Grace Lee, Alana Hamm
Tech Leads: Babu Chellathurai, Wilson Rivera
Developers: Arnob Hridoy, Prasad Vemula, Keith Zane, Rajaprakash Ramanathan